
Imagine you have a provision shop where you sell many products. Or you offer different services to your target market. Or you have tried a few side hustles and now have to choose where to put in more of your limited resources. Maybe you have an established business and must decide how the year’s business expenditure should go.
In all these instances, we have to decide whether and where to allocate extra resources, cash out or look elsewhere and divest.
BCG MATRIX BASICS
The BCG Matrix, also called the Growth-Share Matrix, emerged as a reaction to the need for a scientific technique to assess a corporation’s several product services. Bruce Henderson, the founding father of the Boston Consulting Group, added the matrix in 1970. It aimed to offer a smooth but effective framework for studying an enterprise’s product portfolio and guiding strategic selections.
The matrix classifies merchandise into four classes based on market growth rate and relative market share.
A high market growth rate means that product/service lines grow rapidly. When your market grows, you must invest to increase capacity and marketing spending to secure your market share. A product or service with a high market growth rate might be attractive, but that consumes cash quickly.
Relative market share is just as the name says, with a significant emphasis on “relative”. How much of the market is not what we are talking about here – it’s how much of the market you have compared to the next guy, your colleagues and competitors. The rule of thumb is to divide your market share by that of your largest competitor, giving you your relative market share. If you have a 5% market share and your biggest competitor has a 50% market share, then your relative market share is 5% divided by 50%, which comes to a 10% relative market share.
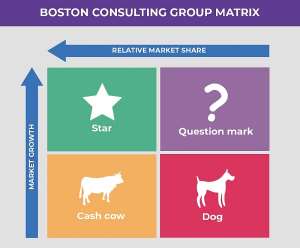
THE FOUR QUADRANTS OF THE BCG MATRIX
Let us imagine the Relative Market Share on an x-axis and the Market Growth Rate on a y-axis. Visualise it. The high and low points on each axis create four quadrants that are:
- high relative market share, high market growth rate – we call this the STARS.
- high relative market share, low market growth rate – we call this the CASH COWS.
- low relative market share, high market growth rate – we call this the QUESTION MARKS.
- low relative market share, low market growth rate – we call this the DOGS.
In reality, most new business products or services start as QUESTION MARKS because they have very little or no relative market share but usually operate in an environment with a high market growth rate. They have the potential to become STARS should they capture a bigger chunk of the existing booming market. Easier said than done.
If you’re wondering why most businesses do not start as DOGS, starting a product or service already means you have a meagre relative market share. Why would anyone also start a business in a market with a low growth rate? It’ll be much harder to get out of there. Beginning as a QUESTION MARK is ideal.
Almost always, question marks generate very little cash but will need more cash than they generate to get them to be hopefully STARS or even CASH COWS. If not analysed and appropriately managed, after years of pumping money into them, QUESTION MARKS can degenerate into DOGS, and you may never recoup your investment.
But let’s assume everything went well. Your QUESTION MARK, that product or service with a low relative market share in a high market growth rate, now has a high enough relative market share to become a STAR. What does that mean?
It means you are selling more. It means that of all the customers who need that product or service, a good number of them come to you, which means you are generating high amounts of cash and revenue. It means you have a good thing going. But it would help if you spent some of that cash to maintain your current market share, fend off competitors, and grow!
You must recognise the STARS you have as an entrepreneur and nurture them. Successfully diversified companies always have some STARS in their portfolio to ensure future cash flows. STARS are also always great for your brand image, serving as your flagship product – like the iPhone does for Apple. The iPhone is Apple’s STAR product. Per our definition, the iPhone has a high relative market share in its product category and a high market growth rate.
As time goes on, your STAR, managed properly, will beat off competition and maintain a high relative market share, but the market growth rate will decrease in time as well, making it a CASH COW - a high relative market share with a low market growth rate. It is called a CASH COW because while maintaining a relatively high market share, you spend less on marketing and investments as your revenue stagnates. YOU still own the lion’s share of the market, so the cash keeps pouring in.
Ergo, CASH COW!
An entrepreneur must milk all this cash (pun intended) from this revenue avenue and invest it strategically into STARS or new product lines, the QUESTION MARKS. CASH COWS make way more than they need to maintain their business positioning. So they bring stability to a business. The iPad is a good example. The iPad dominates in relative market share for its category. It’s so clear that compared to the STAR of Apple – the iPhone – much less investment goes into the iPad regarding marketing, development, etc. With a high relative market share, stagnated market growth rate and cash still flowing in from sales while expenditure on the product decreases, Apple has created the perfect CASH COW in the iPad.
But then there are the DOGS, like the iPod (now discontinued), with a low or declining market growth rate and a low or declining market share. I still have an iPod Touch. I get why Apple discontinued it. DOGS don’t make or break the business. They barely consume any money and barely make you any money, but as a business unit, it has enough cash within its business unit that can be put to better use. So they’re not fun, not attractive enough for finance, marketing or R&D to put their backs into it. But again, money is involved to keep that business unit alive, which could be divested elsewhere.
THE BCG MATRIX AND YOUR PRODUCT LIFECYCLE
• We already stated that your product usually starts as a QUESTION MARK. The moniker is entirely appropriate since there’s the question of whether it will succeed.
• As the product grows bigger and gains a higher relative market share, it becomes a STAR.
• In time, every upward trajectory must plateau, permanently or temporarily. While holding on to that high relative market share, as the market growth rate slows, there is a corresponding decrease in expenditure on advertisement and other business development investments. At this stage, you get a CASH COW. You milk that money with very little work.
• When you get too comfortable, a CASH COW will lose its relative market share; don’t forget that it already has a low market growth rate. You might then end up with a DOG – a product with a low relative market share and low market growth rate, but still worth something.
CRITICISMS AND LIMITATIONS OF THE BCG MATRIX
BCG Matrix assumes that relative market share is the sole indicator of competitiveness. This assumption overlooks the importance of product first-rate, brand popularity, and purchaser loyalty. In the modern-day dynamic business, wherein innovation and differentiation play critical roles, excessive precedence on relative market share alone can be misleading.
There is also the argument that this rigid beauty oversimplifies the complexities of a dynamic business environment. In truth, products frequently fall perfectly under one quadrant; their strategic positions evolve. The static nature of the BCG Matrix no longer accounts for the fluidity of markets and customer alternatives.
The BCG Matrix also fails to account for out-of-door factors that could impact a product’s overall performance; it focuses on internal factors. For example, a surprising shift in patron behaviour or a disruptive generation can considerably alter a product’s prospects, rendering its BCG Matrix categorisation outdated. It also fails to consider the synergy among products and the strategic implications of the overall portfolio. It does not provide insights into how products within your portfolio complement each other.
Moreover, the BCG Matrix assumes that profitability is directly proportional to relative market share. While a high relative market share may be a contributing factor to profitability, it might not guarantee project sustainability. The model needs to touch on the costing, sale structure and pricing approach.
FUTURE OUTLOOK
Despite its criticisms, the BCG Matrix is an essential tool for entrepreneurs and businesses seeking to navigate the complex terrain of product portfolio management. Its capacity to categorise products/services into STARS, CASH COWS, QUESTION MARKS, and DOGS provides a simple-enough roadmap for strategic planning.
The BCG Matrix is not a static photograph but a dynamic framework that should evolve with marketplace modifications and product life cycles. It compels businesses to constantly re-examine their portfolio, adapting strategies to capitalise on rising possibilities and mitigating risks. The emphasis on increasing relative market share and strategic funding allocation resonates with businesses and entrepreneurs looking for success, making it a versatile tool for organisations of all sizes.
I hope you found this article to be an enjoyable read. Your feedback is highly valued and appreciated. I welcome your suggestions for topics you want me to address or provide insights on. You can schedule a meeting with me at your convenience through my Calendly at calendly.com/maxwellampong. Alternatively, you may connect with me through various channels accessible on my Linktree page at https://linktr.ee/themax.
I wish you a highly productive and successful week ahead!
Dr Maxwell Ampong is the CEO of Maxwell Investments Group . He is an Honorary Curator at the Ghana National Museum and the Official Business Advisor with the General Agricultural Workers’ Union of Ghana (GAWU) under Ghana’s Trade Union Congress (TUC). He has a keen focus on relevant economic topics and general perspective pieces.


 We saved $57.9million from procurement of new verification devices, registration...
 Ejisu by-election: Aduomi is a betrayer – Ahiagbah
 Dumsor: I’ll be in police custody if I speak, I vex — DKB
 We'll give daily evidence of Akufo-Addo's supervised thievery from our next gene...
 Asiedu Nketia crying because they've shared the positions and left him and his p...
 Mahama's agenda in his next 4-year term will be 'loot and share' — Koku Anyidoho
 If you're president and you can't take care of your wife then you're not worth y...
 Foreign Ministry caution Ghanaians against traveling to Northern Mali
 GHS warns public against misuse of naphthalene balls, it causes newborn jaundice
 Our education style contributes to unemployment - High Skies College President
