



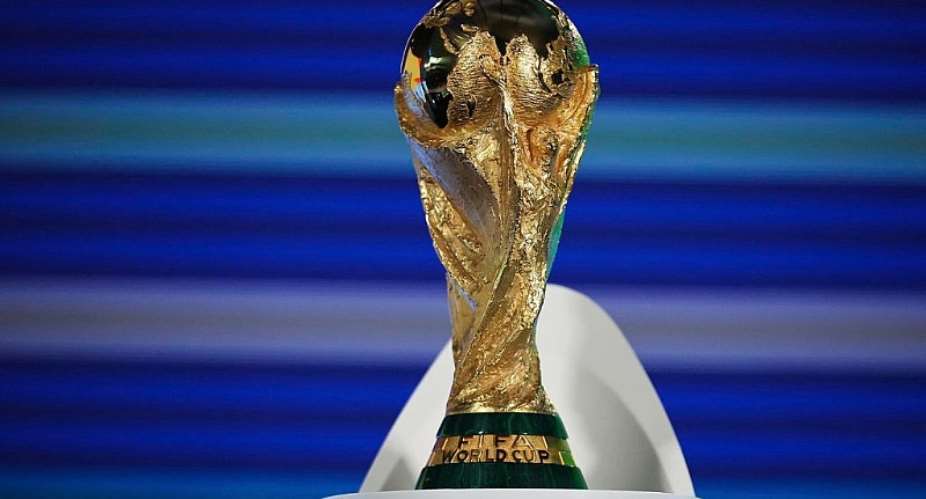
From the USA in 1994 to Qatar in 2022, host nations have spent between $500 million and $220 billion to put on the World Cup. FIFA kept the bulk of the revenue every single time. The host nation is the builder, the funder and the risk-taker. FIFA is the landlord collecting rent.
Qatar spent $220 billion to host the 2022 World Cup and earned approximately $1.56 billion in direct revenue. FIFA earned $7.5 billion from the same tournament. That gap is not a rounding error. It is the business model.
South Africa spent $3.9 billion to host the 2010 World Cup, earning around $400 million from World Cup tourists. Grant Thornton had projected a $12 billion economic windfall. The actual direct return was a fraction of that. The stadiums still sit underused today.
Brazil 2014 is the clearest cautionary tale. Hosting cost $15 billion. Tourist spending returned only 2.5% of that figure in direct revenue. Protests erupted across the country because citizens saw hospitals and schools losing funding to stadiums that cities did not need.
The 2026 World Cup in the USA, Canada and Mexico is the first honest financial model in decades. Using existing NFL and major league stadiums requires no significant new builds. Projected host cost is around
$10 billion, while FIFA is projected to earn approximately $11 billion.
Why This Matters
The World Cup is sold to host nations as an economic opportunity. It is closer to an expensive audition on a global stage, with FIFA collecting the ticket revenue. The gap between what host nations spend and what they earn directly is not an accident. It is built into the structure of how FIFA awards and manages the tournament. Broadcasting rights, sponsorships and ticketing revenue flow to FIFA. Infrastructure costs, stadium construction and security fall entirely on the host.
This matters most for developing nations bidding to host. South Africa, Brazil and Qatar all sold their bids to their publics on economic grounds. In South Africa's case, the direct tourism return was less than 10% of the amount spent. In Brazil's case, it triggered one of the largest protest movements the country had seen in decades. The data makes it clear that hosting the World Cup is a soft power and nation-branding exercise. Countries that treat it as a financial investment are buying something they will not get.
Cost vs Revenue: The Numbers by Tournament
Sources: Statista; Forbes; Michigan Journal of Economics; Washington Times; Sportico; myfootballfacts.com; FIFA official reports.
*2026 figures are projections.
| Tournament | Host Cost | Host Direct Revenue | FIFA Revenue | Tourists |
| USA 1994 | $0.5B | $1B+ (est.) | ~$1.3B | ~3.6M |
| South Africa 2010 | $3.9B | ~$400M (tourism) | $3.4B | ~310,000 |
| Brazil 2014 | $15B | ~$375M (2.5% of spend) | $5.7B | ~1M |
| Russia 2018 | $14B | Limited data | ~$6.4B | ~3M |
| Qatar 2022 | $220B | $1.56B (direct) | $7.5B | ~1.4M |
| USA/CAN/MEX 2026* | ~$10B | TBD | ~$11B (proj.) | TBD |
Detailed Analysis
Recommendations
1. African Football Associations and AU Member States: Any African nation considering a World Cup bid must conduct an independent economic impact assessment before committing public funds. Pre-bid projections from consultants hired to support the bid have historically overstated returns. South Africa's experience is the benchmark case.
2. FIFA: Reform the revenue-sharing model to ensure host nations receive a guaranteed minimum share of broadcasting and commercial revenues. The current structure places all financial risks on the host and all revenue upside with FIFA. That arrangement is not sustainable for developing nations.
3. Host Nations and Bidding Governments: Follow the Germany 2006 and USA 2026 model. Only host if you can use existing infrastructure. Do not build stadiums in cities that do not need them. Infrastructure spend should serve long-term public needs first, not FIFA requirements.
4. Policymakers and Finance Ministries: Require all World Cup impact projections to be stress-tested against past outcomes before parliamentary approval of hosting budgets. Grant Thornton's $12 billion projection for South Africa 2010 bore no relationship to the actual return. Parliament should never approve a hosting bid based on a single consultant's optimistic forecast.
5. Sports Economists and Research Institutions: Build a standardised post-tournament economic assessment framework, covering direct tourism revenue, stadium utilisation rates and infrastructure legacy value, so future hosts can benchmark against real outcomes rather than promotional projections.
Methodology Snapshot
This is a Rapid Research publication drawing on publicly available economic data, verified news reporting and academic research. Data sources include: Statista hosting cost series (1994 to 2022); Forbes and the Michigan Journal of Economics on Qatar 2022 revenue figures; Sportico (2022) on FIFA net financials; the Washington Times (2012) and South Africa Ministry of Tourism (2010) on South Africa 2010 outcomes; Bruegel.org (2018) on Brazil 2014 tourist return ratios; myfootballfacts.com (2026) on tournament-by-tournament economic patterns; BusinessTats.com (2026) on comparative host costs; peer-reviewed research by Maennig and du Plessis in Development Southern Africa (2011); and FIFA official financial reports. The analysis covers tournaments from 1994 to 2026, with 2026 figures based on publicly available projections at the time of publication.
Limitations
● Long-term economic returns from hosting, including sustained tourism growth and infrastructure legacy value, are not captured in the direct revenue figures presented here. Qatar's and South Africa's actual returns over 10 to 20 years may differ from short-term data.
● South Africa 2010 revenue figures are drawn from official Ministry of Tourism survey data and the Washington Times reporting on government final accounts. FIFA's full financial breakdown for that cycle was not publicly disaggregated by host.
● Brazil 2014 tourist revenue return ratio (2.5% of total expenditure) is drawn from Bruegel.org analysis. Exact direct tourism revenue figures for Brazil 2014 were not independently confirmed from Brazilian government accounts.
● 2026 cost and FIFA revenue figures are projections as of July 2026. Actual figures will differ.
● Russia 2018 host direct revenue data is limited in publicly available sources. The table notes this accordingly.
Sources and References
1. BusinessTats.com. "Total Cost of Hosting the World Cup 1994-2022." May 30, 2026. businesstats.com
2. Michigan Journal of Economics. "The Finances Behind the 2022 World Cup." January 2023. sites.lsa.umich.edu/mje
3. Sportico. "World Cup Economics: Qatar Record Spending Is Unlikely to Pay Off." November 2022. sportico.com
4. Forbes. Qatar 2022 host revenue vs FIFA revenue figures. Cited in Michigan Journal of Economics (2023) and SnoQap (2024).
5. Washington Times. "South Africa spent $3 billion on 2010 World Cup." November 2012. washingtontimes.com
6. South Africa Ministry of Tourism. "2010 FIFA World Cup Tourism Impact Survey Results." 2010. tourism.gov.za
7. Maennig, W. and du Plessis, S. "The 2010 FIFA World Cup high-frequency data economics: Effects on international tourism and awareness for South Africa." Development Southern Africa, 28(3), 2011..
8. Bruegel.org. "World Cup Economics." July 2018. bruegel.org
9. myfootballfacts.com. "Hosting the World Cup: Economic Impact and Legacy." June 2026. myfootballfacts.com
10. Wikipedia. "Economics of the FIFA World Cup." Accessed July 2026. en.wikipedia.org
11. Swiss School of Business and Management Geneva. "Is the FIFA World Cup 2022 in Qatar profitable?" December 2022. ssbm.ch
12. Britannica Money. "Economics of the World Cup." July 2026. britannica.com/money
13. SnoQap. "A Look Into the Economic Impact of Hosting the World Cup." April 2024. snoqap.com
14. WorldCupRadar. "Qatar World Cup 2022 Earnings: $220B Investment vs $4-6B Revenue Breakdown." August 2025. worldcupradar.com
15. Moyo, B. and Gwatidzo, T. "Analyzing the Impact of the 2010 Soccer World Cup on South Africa: A Synthetic Control Method." SAGE Journals, 2026.

 Post-clean-up exercise: Military, other services to continue dredging waterways ...
 Mahama calls for monthly national clean-up exercises to tackle flooding
 Supreme Court must dismiss presidential term limit suit outright — Prof Prempeh
 Firefighters rescue driver after vehicle crashes into ECG pole at Anfoega-Adame ...
 Forestry Commission Youth Champions lock-up Tamale office over unpaid walaries
 I will use any MMDCE who authorise construction on waterways as scapegoat — Lind...
 EPA shuts down fuel station in Kasoa over choked drains
 Presidency to demolish encroaching structures around Tesa Dam, East Legon to red...
 Ghanaians in Nigeria urge Mahama, Tinubu to intervene in JonahCapital dispute
 President Mahama joins Tse Addo residents for National Clean-up Exercise

