
All economies under the sun have gone through several phases of the economic cycle from boom to depression or from prosperity to depression. It does not matter whether we are discussing the economic history of advanced, emerging and developing economies, Sub-Sahara Africa and even Ghana,
Economic Cycle
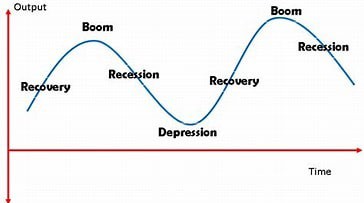
Source: economic cycle diagrams from mrbanks.co.uk
The graph reveals that there is time for boom, recession, depression, and recovery. If the economy is experiencing, a boom step should be taken to sustain it. If the economy is experiencing a decline, steps should be taken to avoid a recession and depression. Even if recession or depression takes place, efforts should be put in place to ensure recovery.
In presenting this brief analysis, part of the data and graphs have been sourced from the IMF, National Budgets from 2017 to 2022. A five year is considered to provide easy to observe patterns to be able to question and develop policy measures to address. This is easy to understand, easy to communicate and create an active memory for the reader with reference to the tables or the graphs. For example, it is easy to ask why the growth for all the sectors declined from 2017 to 2019?
Economic Growth Projections And Recovery
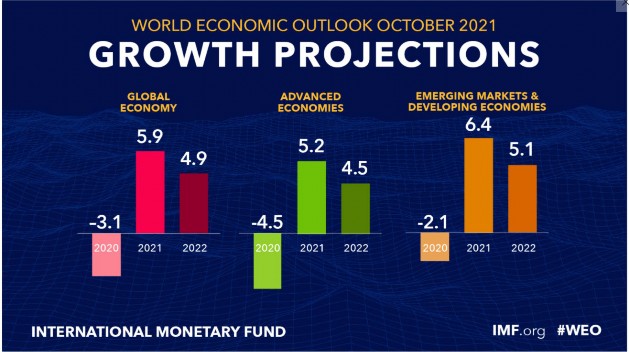
In 2020, the economic growth for the world economy. advanced economy, and that of emerging markets and developing economies were all negative. Recovery efforts that were deployed produced significant growth in 2021 with positive growth projections for 2022 as in the World economic growth projection graph above. The lesson is that in times of depressed financial, economic, and fiscal situation, the focus should be on recovery efforts and strategy and not the defense of the depressed situation to look good.
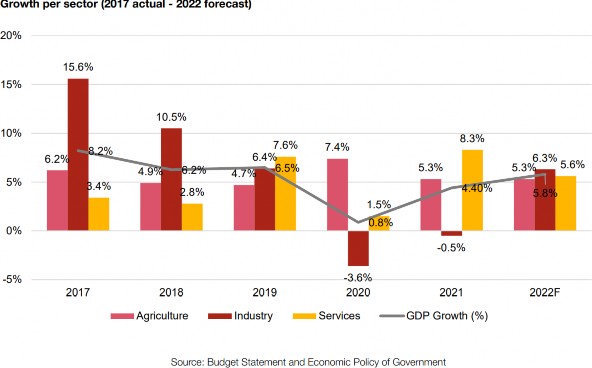
The growth per sector graph below also shows downturn from 2017 to 2020. Also the graph shows that from 2017 to 2019, agriculture, industry and services declined except in 2019 that Services recovered marginally. However, in 2020, industry growth was negative(-3.6%) with services just below 1%. In 2021 agriculture and services sectors recovered but industry recorded
-o.5% growth with all the three sectors projecting recovery in 2022. The summary is that all the sectors were experiencing decline before COVID-19 and became worse during the peak of the
pandemic. The period of decline coincide with the implementation of planting for food and jobs and one district one factory policies. This calls some investigation into the policies.
Government’s position on public debt
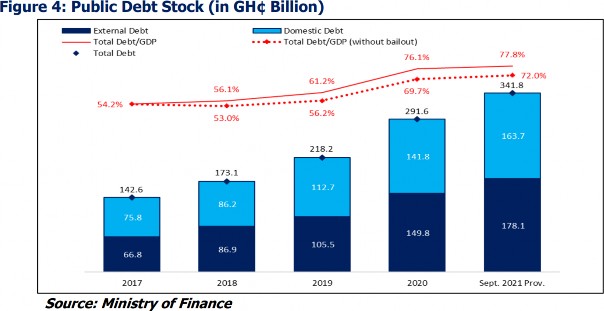
The figure 4 in the 2022 budget as indicated below shows that external debt as ratio of total debt, increased from 47% of total debt in 2017 to 52% in 2021 September. As the cedi depreciated from GHS4.20 to GHS6.25 over the period, the depreciation contributed hugely to the debt stock of the country. Between 2017 and 2021 September, external debt in absolute term, increased by 62.5% while domestic debt increased by 53.7%. The graph also shows that Debt/GDP increased from 54.2% in 2017 to 77.6% in September 2021 even though the GDP was rebased in 2019/2020 if not so the Debt/GDP would have been worse. It is precarious that between 2017 and 2019 the Debt/GDP ratio increased by 7% and between 2019 and 2020 the Debt/GDP increased by 14.9%. This shows that COVID-19 pandemic was used as an excuse to borrow excessively. The threshold for debt sustainability internationally is 60%, implying that the threshold was breached with debt distress indication since 2019. However, using ECOWAS convergence criteria of ≤70%, the public debt showed indication of distress from 2020.
Ghana’s worse income distribution using the Lorenz curve
The Lorenz curve shows whether income distribution among the population is equitable or worse for Ghana. The curve for Ghana is farther away from the line of equity hence worse. Population and national income data from the world bank have been used to construct the Lorenz curve. Even fragile states performed better than Ghana. Job creation efforts are needed to help citizens share in national income.
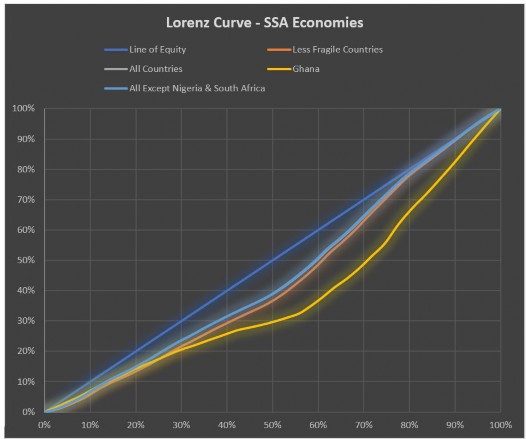
Source: Graph drawn with Data from World bank 1970 -2020
Table 1: Debt burden indicators
| Year | Debt/Export = 150% | Debt/GDP =60% and 70% | Debt/TotalRev =250% | IntPay/GDP |
|---|---|---|---|---|
| 2016 | 279.63 | 55.68 | 363.04 | 4.90 |
| 2017 | 227.22 | 52.84 | 366.27 | 5.35 |
| 2018 | 240.53 | 55.36 | 365.00 | 4.83 |
| 2019 | 253.52 | 58.50 | 390.73 | 5.55 |
| 2020 | 359.08 | 76.05 | 529.01 | 6.41 |
| 2021~~ | 405.02 | 76.51 | 485.82 | 7.28 |
Computed by Author with data from IMF and National Budgets
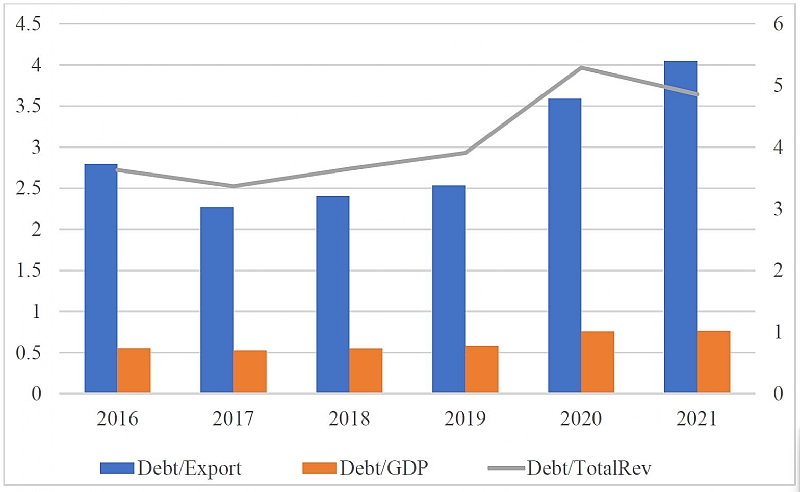
The usual debt burden indicator is the Debt/GDP. Though it does not reveal all the implications of the level of debt of a country, it is an important indicator that communicates possible distress. The indicators are interpreted based on a benchmark as constructed by the IMF for emerging and developing countries. When the international debt sustainability ratio of 60% is used, it means in 2020 and 2021 Ghana’s debt has crossed over to unsustainable level. This should have started from 2019 had it not been for the rebasing of the GDP. However, with the ECOWAS.
convergence criteria of ≤70%, Ghana’s debt is not sustainable and induced distress. Since revenue is generated to finance expenditure, we computed Debt/Total revenue and compared with the benchmark of 250%. The Debt/Total revenue ratios from 2017 to September 2021 shows unsustainability of Ghana’s debt with 113.04% deterioration in 2017 and 235.82% deterioration in 2021. It means total revenue could only cover the debt in 2017 if the revenue were to increase by 113.04% and 235.82% in 2021. It also means the borrowing is not guided by revenue levels but other factors not in the fiscal responsibility matrix. The Debt/GDP and Debt/Total revenue show increasing trend of deterioration debt sustainability from 2017 to 2021.The debt sustainability of a country also depends on revenue from exports. Thus. we computed the Debt/Export with a benchmark of 150%. However, the ratios show incapability to cover the debt each year from 2017 to 2021. In 2017, more than 77% of export was needed to cover the country’s debt and 255% more export revenue in 2021. It also revealed the need to strengthen export drive through value addition and diversification of export destinations.
Revenue is such an important element in debt management such that when its role is undermined debt distress is sure to occur. Revenue comes from exports, taxes, economic activities through economic growth and jobs. So, borrowing is done with future revenue in mind. Debt management cannot be undertaken without considering all these factors including depreciation. Robust exports, lower interest rate, which is lower than growth rate, good tax administration are all needed to management a sustainable debt regime. Using the Bank of Ghana policy rate as a proxy for interest rate or even 91-day treasury bill rate which all higher than the growth rate implying this vicious cycle must be dealt with. On average yield on our bonds is higher than the growth rate of GDP, so these issues must be worked on.
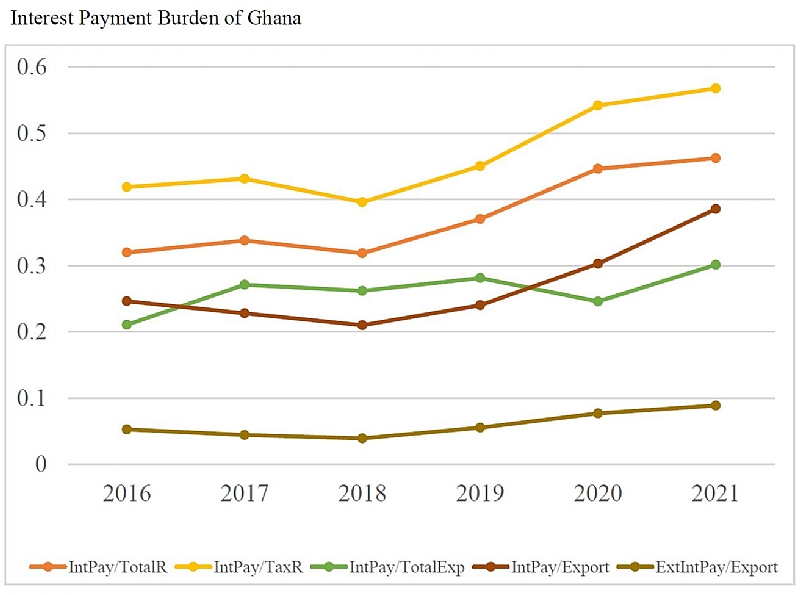
Table 2: Interest Payment Burden Ratios (Debt servicing ratios)
| Year | IntPay/TotalR=20% | IntPay/TaxR | IntPay/TotalExp | IntPay/Export=20% | ExtIntPay/Export |
|---|---|---|---|---|---|
| 2016 | 32.00 | 42.00 | 21.10 | 24.63 | 5.27 |
| 2017 | 33.80 | 43.10 | 27.11 | 22.81 | 4.44 |
| 2018 | 31.90 | 40.00 | 26.20 | 21.00 | 3.93 |
| 2019 | 37.00 | 45.00 | 28.13 | 24.03 | 5.42 |
| 2020 | 44.60 | 54.20 | 25.00 | 30.20 | 7.69 |
| 2021~~ | 46.20 | 57.00 | 30.13 | 38.55 | 9.00 |
Computed by Author with data from IMF and National Budgets
Interest payment /Tax revenue
On average, from table 2, between 2017 and 2021, 47.86% of tax revenue has been spent to pay interest on Ghana’s debt and 57% in 2021, meaning the tax revenue is so burdened that it cannot support three major expenditure items. and therefore, continue to deepen the vicious cycle of high borrowing and high interest payment. This is not sustainable. Another determinant of interest burden is interest payment /Total revenue with benchmark of 20%. Between 2017 and 2021, on average 38.7% of total revenue is spent on interest payment which is above the threshold.
Both interest payment /Total revenue and Interest payment /Export have been outside the benchmark, meaning all the debt sustainability ratios show serious vulnerability and distress.
The use of the word’’ broke’’ in financial discussions
Technically experts prefer to describe acute financial situation of a country using expressions like debt distress, financial distress, default, risk of the economy and debt sustainability among others. All the debt sustainability analysis in this paper confirms fiscal distress, repayment burden and general hardship but will not simply use the word broke. Ordinarily when a person is ‘broke’ it means in the immediate time, he/she is not able to finance some basic needs because the level of income is limited. Some, people use the term to mean so many things including poverty, bankruptcy, and default. In extreme cases some use the word synonymous with a failed state. The use of the word especially for government finances sometimes create difficulties for government communicators.
When the word is used, it is only to express the sufferings, hardships, inability of government to meet the expectations of citizens. The word does not mean there is no money. It only means the needs are not being met and is creating disappointments. It does not mean that natural resources have finished, nor does it mean the government is not collecting taxes to generate revenue. It could however mean the public and opposition politicians are saying there is mismanagement, unprioritized expenditure, corruption, overborrowing, excessive taxes but the government is not able to deliver. The public knows that it is because the country is facing financial, economic, and fiscal difficulties that is why in the mist of well-articulated hardships, effects of depreciation on prices and public debt, many uncompleted projects, unpaid contractors and marginal increase in public sector wages and salaries. The government should understand that the public understands when using the word, the country is broke. They know all state institutions including Ghana Revenue Authority (GRA), Bank of Ghana are still functioning. In fact, they know our cherished traders, entrepreneurs, spare part dealers, farmers and indeed washing bays, hairdressing salons and baberingshops are still in operations. What they are communicating using the word is upward price development, inability to finance the home out of their toil and that over borrowing, high interest payment are the reasons for their suffering.
When government wants to introduce e-levy without refining it to reflect the concerns of the public it is because government does not have enough revenue and is facing interest payment challenges. The business community knows that if banks are lending to government more than them, it is because government’s appetite for borrowing is competing with them to meet the acute financial needs. Thus, the use of the word may be full of ‘undecoded’ verdicts on the government.
Conclusion
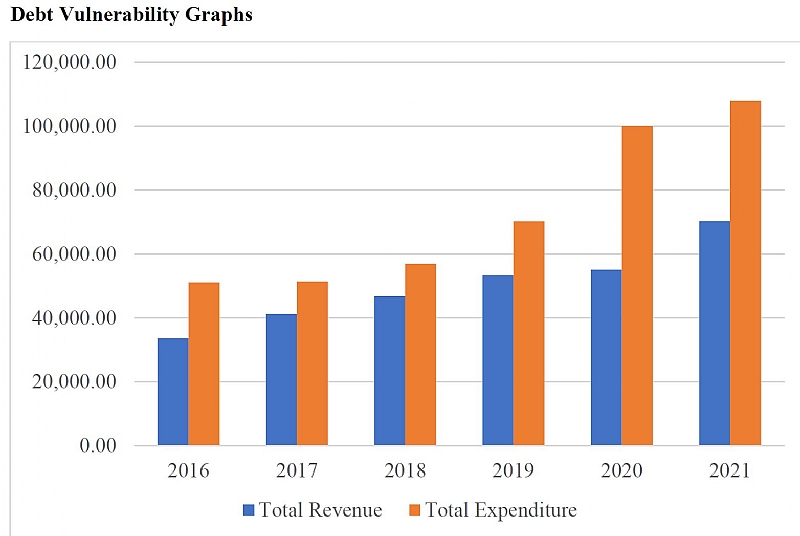
The use of tables and graphs covering a 5-year analysis from 2017 to 2021 provides a quick visual impression of fiscal vulnerability, debt distress and interest payment burden of the Ghanaian economy. The trend provides a clear picture of unsustainability of borrowing. The economy is suffering from debt repayment burden, lower revenue than expected to remain sustainable. Ghanaians use the word ‘broke’ to convey hardships and inability of government to meet basic expectations. The graphs below show increasing levels of both revenue and expenditure but expenditure trends up more than revenue. Thus, it is not true that revenue has not been performing the problem is with the unwillingness to change the expenditure model. Dealing with export measures can also contain the debt distress of the Ghanaian economy. The trend helps to make understanding (simple and appreciate the clear picture provided over time, not at one point in time but over a period (2017-2021). It helps to interrogate the trend for policy intervention as the main drivers and direction are seen over time. Sectoral performance trended downwards from 2017 even though flagship policies such as planting for food and jobs and one district one factory.
Sources of data for the computations, tables and graphs
- International Monetary Fund (IMF) economic and fiscal data
- National Budgets of Ghana – 2017-2022
- World Bank economic data
 Reintroduce Fiscal Responsibility Act to tackle election budget overrun — Osafo ...
 Flooding: Obey weather warnings – NADMO to general public
 Fire in NDC over boycott of Ejisu by-election
 NDC to outdoor Prof Jane Naana Opoku-Agyemang as running mate today
 Ejisu: CPP seeks injunction to stop April 30 by-election
 Dismiss ECG, GWCL, GACL bosses over losses – United Voices for Change tells gov’...
 Submit 2023 audited financial statements by May – Akufo-Addo order SOEs
 Current power outages purely due to mismanagement – Minority
 ECG hoists red flag to fight Ashanti Regional Minister over arrest of General Ma...
 Mahama’s 24hr economy will help stabilise the cedi; it’s the best sellable polic...
