




Africans express broad social tolerance but restrictive attitudes toward immigration, the latest Afrobarometer Pan-Africa Profile reports.
The new analysis, based on 50,961 interviews across 38 African countries in 2024/2025, shows that while large majorities accept neighbours of different ethnicities, religions, political affiliations, and nationalities, immigration marks a boundary of inclusion. Fewer than half of Africans believe immigrants benefit their economy, and majorities favour admitting fewer foreign job seekers and refugees, with South Africa expressing some of the continent's most restrictive views.
The report also shows that most Africans value their national identity at least as highly as their ethnicity; many value them both equally. But perceptions of unfair treatment based on ethnicity are widespread,
Overall, the findings portray a continent characterised by strong family and community ties and broad social tolerance, but weaker trust across social boundaries, restrictive attitudes toward immigration, and concerns about institutional fairness.
Key findings
- On average across 38 African countries, 81% of citizens say they trust relatives "somewhat" or "a lot," vs. 58% who trust their neighbours and around half who trust people of a different ethnicity (49%) or religion (48%) (Figure 1).
- Africans are more tolerant than trusting. Large majorities would welcome or accept living next door to people of a different ethnicity (87%), religion (84%), political party (81%), or nationality (77%) (Figure 2).
- Tolerance toward refugees is somewhat weaker (69%), and only 22% would not mind having homosexual neighbours.
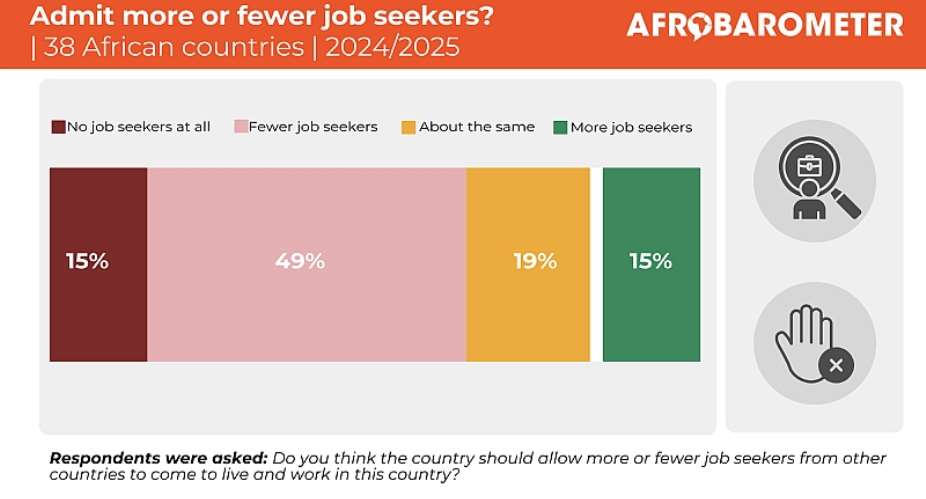
- Most Africans say their government should admit fewer or no foreign job seekers (64%) and refugees (70%) into the country (Figure 3).
- Africans are evenly divided on whether immigrants make a positive (45%) or negative (44%) contribution to the economy (Figure 4).
- Almost nine in 10 Africans (85%) say they value their national identity at least as highly as their ethnic one. A plurality (46%) say they feel equally attached to both (Figure 5).
- While a majority (56%) of Africans say the government “never” treats their ethnic group unfairly, four in 10 say this happens “sometimes” (24%), “often” (11%), or “always” (6%) (Figure 6).
Afrobarometer surveys
Afrobarometer is a pan-African, nonpartisan survey research network that provides reliable data on African experiences and evaluations of democracy, governance, and quality of life. Ten survey rounds in up to 45 countries have been completed since 1999. Round 10 surveys (2024/2025) cover 38 countries.
Afrobarometer’s National Partners conduct face-to-face interviews with nationally representative samples of adults in the language of the respondent’s choice that yield country-level results with margins of error of +/-2 to +/-3 percentage points at a 95% confidence level. For more on the sampling methodology, click here.
Charts
Figure 1: Interpersonal trust | 38 countries* | 2024/2025
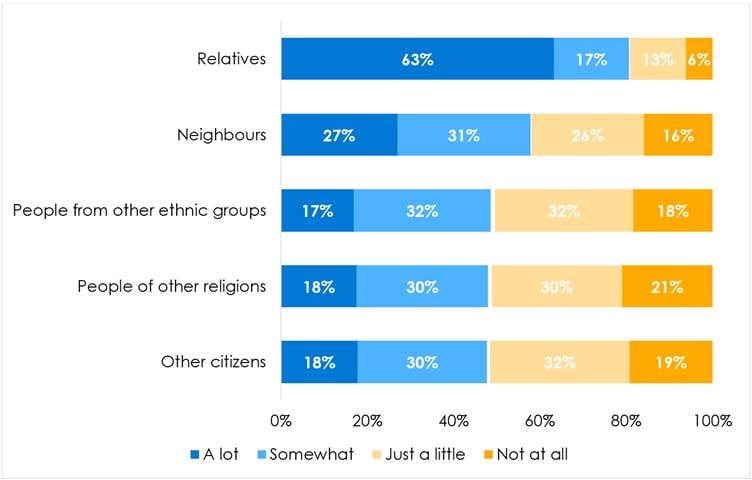
Respondents were asked: How much do you trust each of the following types of people?
*The question about other ethnic groups was not asked in Tunisia, Comoros, and Seychelles.
Figure 2: Social tolerance | 38 countries* | 2024/2025
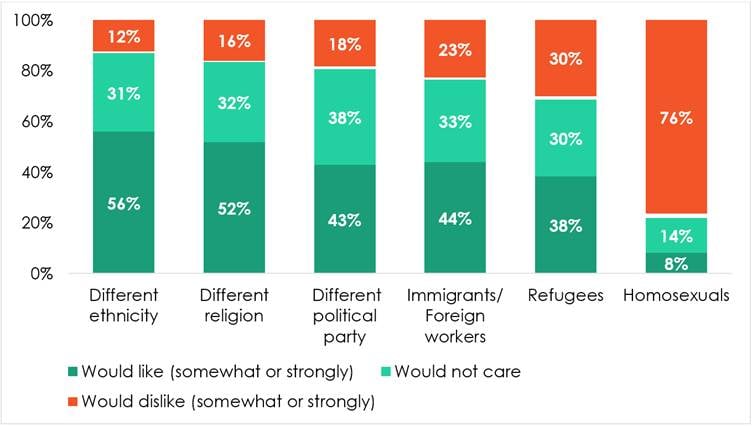
Respondents were asked: For each of the following types of people, please tell me whether you would like having people from this group as neighbours, dislike it, or not care: People of a different religion? People from other ethnic groups? Homosexuals? Immigrants or foreign workers? People who support a different political party? Refugees from other countries fleeing political violence or persecution?
*The question about different ethnicities was not asked in Tunisia, Comoros, and Seychelles.
Figure 3: Admit more or fewer job seekers and refugees? | 38 countries | 2024/2025
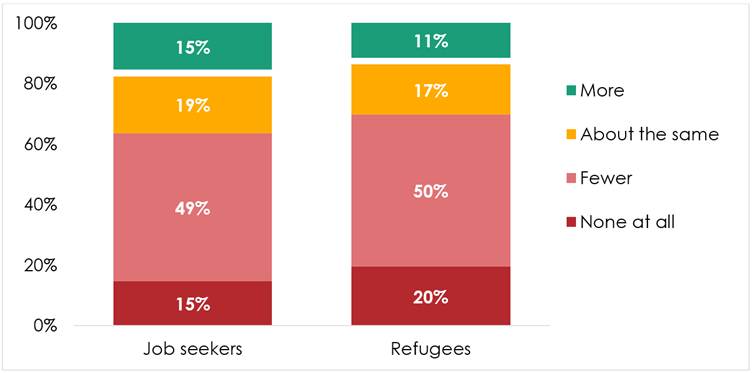
Respondents were asked: Do you think this country should allow more or fewer job seekers from other countries to come to live and work in this country? Do you think this country should allow more or fewer refugees from other countries to come and live in this country?
Figure 4: Economic impact of immigrants | by country | 38 countries | 2024/2025
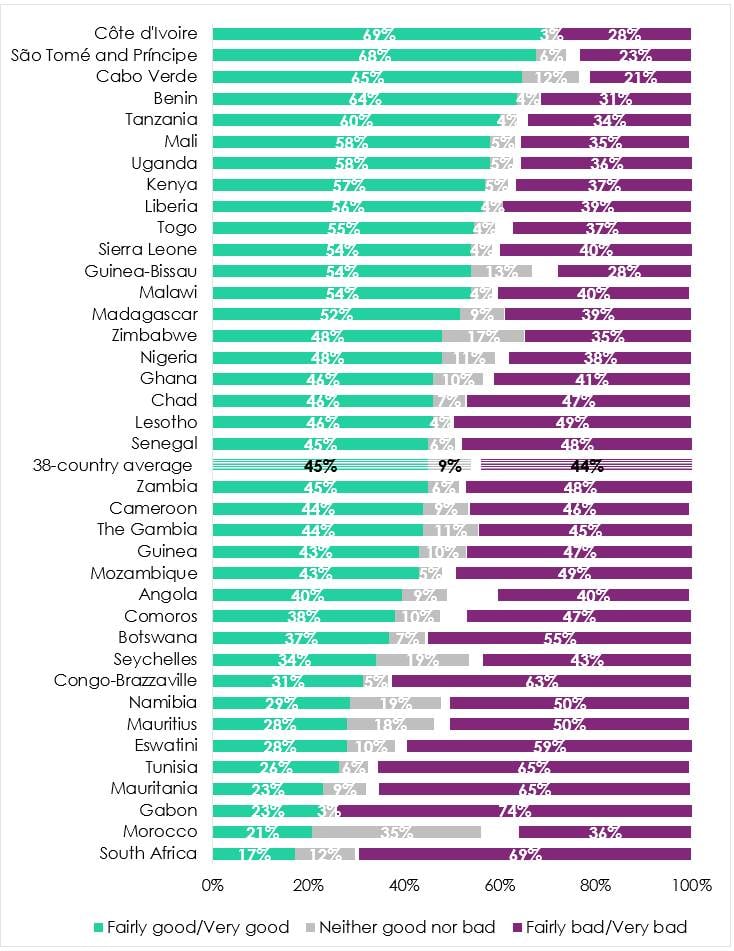
Respondents were asked: Would you say it is generally bad or good for [country]’s economy if people from other countries come here to live and work for several years?
Figure 5: National vs. ethnic identity | by country | 32 countries* | 2024/2025
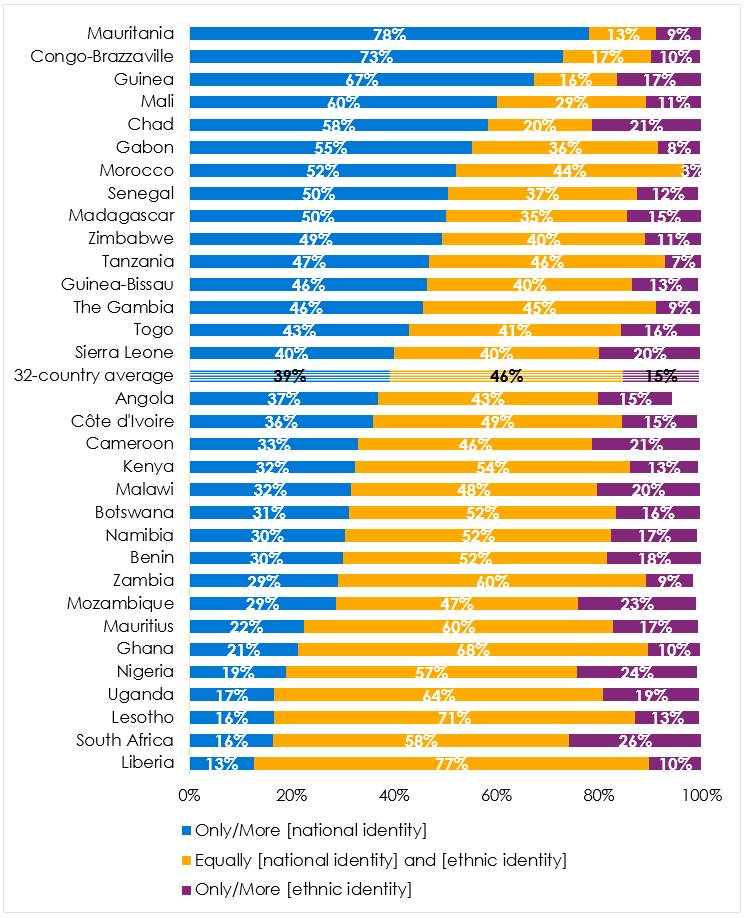
Respondents who identified with a particular ethnic group were asked: Let us suppose that you had to choose between being a [national identity] and being a [member of respondent’s ethnic group]. Which of the following statements best expresses your feelings?
* The question was not asked in Cabo Verde, Comoros, São Tomé and Príncipe, Seychelles, and Tunisia. In other countries, respondents who identified only with their national identity and not an ethnic group (5% of all respondents) were not asked this question. Results for Eswatini, where only three respondents identified with a particular ethnic or cultural group, are excluded.)
Figure 6: Ethnic group treated unfairly by government | 32 countries* | 2024/2025
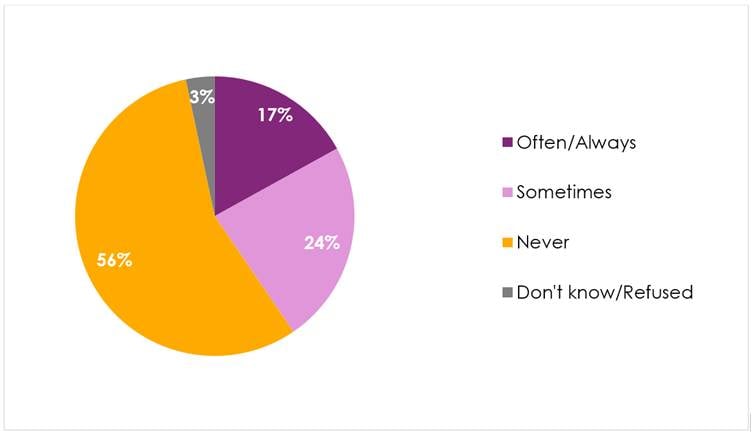
Respondents who identified with a particular ethnic group were asked: How often, if ever, are [members of the respondent’s ethnic group] treated unfairly by the government?
*The question was not asked in Cabo Verde, Comoros, São Tomé and Príncipe, Seychelles, and Tunisia. In other countries, respondents who identified only with their national identity and not an ethnic group (5% of all respondents) were not asked this question. Results for Eswatini, where only three respondents identified with a particular ethnic or cultural group, are excluded.)

 Macron promises tough punishments for rioters during nationwide day of action
 Trump endorses embattled Israeli PM Netanyahu ahead of October 27 election
 We are going to provide emergency airstrip in regions without airports — Mahama
 Nana Konadu maiden memorial mass set for October 23
 'Double standards are not helpful, wrong yesterday is wrong today' – Ablakwa on ...
 NPP has resolve internal wrangling — Bawumia
 Ghana, US Virgin Islands agree on recruitment of Ghanaian teachers, nurses
 “Soldiers Will Stay There”—Mahama Declares Permanent Military Presence in Forest...
 ‘No Borrowing Involved’ — Mahama Rolls Out US$10bn New Economy Policy
 “Ask Jean Mensa to resign first”—Tanko-Computer fires back


