
Over the last decade there has been phenomenal growth in cellular subscriptions across the world. It is estimated that by the end of 2015, there will be more mobile devices in use than people on Earth. The Ghanaian telecom sector alone has seen a marginal increase of 0.41%,from February 2015’s figure of 31,028,253 to 31,154,420 at the end March 2015.
In order to satisfy this mounting demand for good uninterrupted connectivity, the network of telecom towers has to increase to diffuse the regions of the country. However, as most of the telecom towers sited in the cities and urban areas are not immune to the current dumsor-dumsor, same can be said of those in the rural and other remote regions (mountaintops, forests and jungles, deserts) where the grid is absent.
Consequently, telecom companies havecounted on diesel generators as a source of power, but diesel generators run at a lower efficiency level and have become more costly to operate, and produce high CO2 emissions.
Solar Powered Hybridelectrical system is an efficient solution to Diesel Generators as it can reduce operating costs of Diesel Generators and provide an uninterrupted power supply throughout the life of a project.
Let’s examine the economic and environmental impact of using solar PV -hybrid system instead of diesel generators, considering both running and fixed costs.
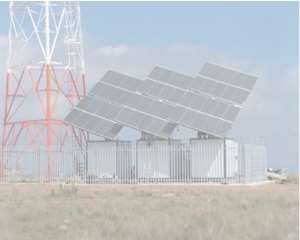
A PV -hybrid system with a capacity of around 8-10 KW peak power in three different tower locations (names withheld) in Kumasi, where diesel generators is a main source of Power.
Table 1. 15kVa Diesel Generator
| SITE (Kumasi) | Estimated Amount of litres consumed/year | Estimated Amount of litres consumed/day | Per litre Cost of Diesel (Goil rate) GHC | Daily Energy Consumption (kWh) | Total max power demand
| Estimated Yearly Energy consumption kWh | Amount spent on diesel per year (GHC) |
| 1 | 6030 | 16.52 | 3.42 | 36.00 | 2.738 KW | 13176 | 20,623.00 |
| 2 | 5300 | 14.52 | 3.42 | 32.25 | 2.288 KW | 11785 | 18,126.00 |
| 3 | 6000 | 16.44 | 3.42 | 34.53 | 2.473 KW | 12638 | 20,520.00 |
Load at site includes: CFL lamp, Air conditioner, Fan unit, Modem, Microwave cell equipment
Table 2. CAPEX and OPEX of Diesel Generator
| Item | SITE 1 (COST $) | SITE 2 (COST$) | SITE 3 (COST$) |
| Cost of 15kVa Generator (2 per each site) | 12,000.00 | 12,000.00 | 12,000.00 |
| Yearly Diesel consumption (3.2GHC=1 $USD) | 6,445.00 | 5,664.00 | 6,413.00 |
| Yearly Maintenance cost (Oils/filters) | 3,048.00 | 3,048.00 | 3,048.00 |
| Diesel transport and Emergency services | 700.00 | 700.00 | 700.00 |
| Total | 22,193.00 | 21,412.00 | 22,161.00 |
Table 3. Per Unit cost of Diesel Generator (Assume a depreciation factor of 0.1 on CAPEX)
|
| Yearly cost/ Yearly Energy | Per Unit cost ($USD) |
| SITE 1 | 11393/13176 | 0.86 |
| SITE 2 | 10612/11785 | 0.90 |
| SITE 3 | 11361/12638 | 0.89 |
Note: A 15KVA generatorwith a load of 80%, the generation is 3KWHr per Litre.
Table 4. Analysis on PV Hybrid system
| Element | SITE 1 | SITE 2 | SITE 3 | Lifetime (Years) |
| Inverter 3Kw (1.2USD per watt)Qty 1 | 3,600.00 | 3,600.00 | 3,600.00 | 25 Years |
| PV Module (135W, 1.0 USD per watt) Qty9720WP | 9,720.00 | 9,720.00 | 9,720.00 | 25 Years |
| Charge controller (12 kW, 0.8USD per watt) Qty 1 | 9,600.00 | 9,600.00 | 9,600.00 | 25 Years |
| Batteries 2V/2700Ah (860 USD per watt)Qty 24 | 20,640.00 | 20,640.00 | 20,640.00 | 10 Years |
| Others | 9,720.00 | 9,720.00 | 9,720.00 | 25 Years |
| Total CAPEX | 53,280.00 | 53,280.00 | 53,280.00 |
|
| Yearly O&M Cost&Electrical Losses | 700.00 | 700.00 | 700.00 | Yearly |
| Salvage Value | 5,400.00 | 5,400.00 | 5,400.00 | Yearly |
| TOTAL OPEX | 6,100.00 | 6,100.00 | 6,100.00 |
|
Annual savings after implementing PV System
Monthly Saving US$= E pv output/month * Z, where
E pv output/month = the monthly PV energy output,
Z = the total cost of 1KWh in US $ produced from diesel generator.
Estimated Values Solar PV Hybrid System.
| SITE | E pv output/month kWh | Savings USD $ | ROR | (Life Cycle Cost/Yearly Energy Consmption) | Per Unit Cost of Energy USD $ |
| 1 | 10,671 | 12,165.00 | 19.5% | 7265/13176 | 0.55 |
| 2 | 10,088 | 12,610.00 | 22.1 % | 7265/11785 | 0.62 |
| 3 | 9,689 | 10,755.00 | 16.2% | 7265/12638 | 0.57 |
Calculating the Unit cost of Energy from PV Systems
Life Cycle Cost LCC (AW) = C investment.AW + C annual + Cbat rep.AW - Csalvage.AW
Unit energy cost$ per/kWh = (Life Cycle Cost/Yearly Energy Consmption)
Comparing per kWh cost for Diesel Generators and PV Hybrid System
| SITE | Per kWh cost Diesel Generators | Per kWh cost Solar PV Hybrid System | Savings on Diesel Generators | % Savings |
| 1 | 0.86 | 0.55 | 0.31 | 36.0 |
| 2 | 0.90 | 0.62 | 0.28 | 31.1 |
| 3 | 0.89 | 0.57 | 0.32 | 35.9 |
In conclusion, it is glaringly evident in this brief analysis that there’s an average savings of about 30% in both CAPEX and OPEX considering the per kWh cost over a 25year period. Even though this analysis was done exclusively on a 24hour/day, the solar pv hybrid system can be used together with the grid or the generator set. The solar PV hybrid system saves a huge amount of money and greenhouse gas emission. The main advantage of this solar PV hybrid system involving the battery and inverter is its ability to deliver the required amount of energy directly from PV without discharging the battery as far as enough solar radiation on the site.
The resultant effect of this is the increase the batteries lifetime in prevention of frequent start and stop of diesel generator which effectively saves fuel cost of the system. From the result of the simulation it is concluded that PV/Diesel/battery hybrid power system is feasible in terms of economics as well as technically. It has also less greenhouse gas emission and therefore reduces negative externality of diesel generator
Again, I wish to emphasize that the PV solar hybrid systems as analyzed for these towers can be used very effectively and efficiently during all days in the year.
MaxmillianKwarteng
[email protected]
0203369968Top of Form
 “Stand and greet me”: Ban all NPP activities on your land until Akufo-Addo apolo...
 Election 2024: We won't allow you manipulate the process in favour of Bawumia — ...
 Akufo-Addo’s arrogant attitude and utterances give much cause for concern — Maha...
 GUM won't join Alan’s ARC – Osofo Kyiri Abosom
 Jesus Christ died for people in his era, not for me – Osofo Kyiri Abosom
 Ejisu by-election: Vote for Kwabena Boateng to come and help me complete my work...
 ‘He’s just hungry’ – NPP Germany takes Mr. Beautiful to the cleaners; schools hi...
 Politicians have hijacked ownership of media houses to suppress press freedom — ...
 Dumsor: Bawumia admits power challenges; assure Ghanaians they will be over soon
 SML deal is just a modified form of the Agyapa deal – Bright Simons
