
“Whenever you can't balance what you see with what you believe you have conflict.”― Shannon L. Alder
Shannon words have been the issue with a lot of people who get to see a Trading Platforms be it the MT4, the MT5 or other complex platforms on the financial Market. In Ghana anything online becomes a strange tool that can vanish or be missing tomorrow. In the wake of a Global Village it is time to embrace new technologies tried and tested with long historical backing.
The MT4 its software by MetaQuotes Software Corp is a software company that produces online trading platforms for financial markets and is registered in Cyprus but founded and primarily based in Russia. The company's main focus is on Forex market trading software with its trading platform MetaTrader being used in over 450 brokerage companies and banks all over the world.
How does the MT4 work out the numbers? Meet the MT4 ECN Bridge and the STP Technology
MT4 ECN Bridge is technology allowing user to access interbank foreign exchange market through the MetaTrader 4. Other third party software companies have developed Straight-through processing (STP) bridging software to allow the MT4 server to pass orders placed by clients directly to an ECN and feed trade confirmations back automatically.
So the next time you see Future Pip's MT4 Platform is not one design by Future Pip or downloaded and branded with a company's logo. And the green and red stokes is known as the candlestick, so let's go back to history and understand how the candlestick work.
What is a Candlestick?
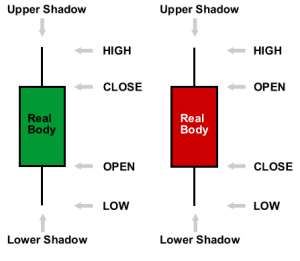
Candlesticks show the price movement in a certain period which is “a day”, by using the trading day's open, high, low and close. A candlestick is composed of a box which is called the body, whose length is the difference between the open and close, and thin vertical lines that are called the shadows above and below the body, representing the high and low prices reached during the day.
A bullish day with a closing price higher than the opening price is shown by a white (hollow) body; while a bearish day with a closing price lower than the opening is shown by a black body. The body becomes a short horizontal line when the opening and closing prices are equal. In this case the candlestick is called a Doji, which usually signifies indecision in the market.
Though single candlesticks convey valuable information about the changes in a market's supply and demand balance, a succession of candlesticks taken together, are more pertinent for this purpose as they make a pattern. The superiority of candlestick patterns over other technical analysis tools in forecasting medium and particularly short term direction is proven. Forecasting with candlesticks requires the proper identification of more than eighty different patterns and a well behaved continuous set of data with no missing observations. Though the patterns on a chart can be roughly identified by eye, today's computers can do this job efficiently and correctly.
Trading signals on the basis of a computer based identification system by using a sophisticated algorithm. The system initially filters the data in order to prevent mistakes due to wrong or missing data. Candlesticks and patterns are then identified automatically and the system also establishes confirmation and stop loss levels for each pattern. Only price data is used. Volume data is omitted.
History of Candlesticks
The western world became acquainted with candlestick charting quite recently but this charting technique has been well known in Japan for a long time. Steve Nison introduced candlestick charting to the western world. According to legend, a Japanese trader Homma Munehisa developed candlestick charting to analyze the price of rice contracts in the 18th century and amassed a huge fortune using this method. Homma used Sakata's Five Patterns, patterns derived from the rules used by local traders from his hometown of Sakata as the foundation of candlestick charting. Nison, however, argues that candlestick charting first appeared sometime after 1850. It is quite possible that Homma initiated this kind of charting in a crude form and his original ideas were later modified and refined over many years of trading eventually evolving to its current form by the late 19th century.
Types of Candlesticks
Candlesticks are classified according to the length of the body, the existence or non-existence of shadows and the length of shadows. The body lengths, which show the strength of the daily price movement, are classified as short, normal and long. The candlesticks characterized by small bodies (spinning tops) or absence of bodies (Doji) signify market indecision. When the day's open, high, low and close are all equal, a Four Price Doji without any body and shadows emerge which most of the time is caused by data errors, or non-traded days. Long black or white (hollow) bodies lacking upper shadows, lower shadows or both are called Marubozu. The body color represents that either the buyers are in control of the market (if white or hollow) or the sellers (if black).
The patterns which are a group of candlesticks interpreted together are formed by two, three, four or five successive candlesticks, the most common of which are two-day patterns. The four or five day patterns are very rare. Most of the patterns are symmetric in nature with bullish patterns having their bearish counterparts similar in shape but different in body color and relative location. However, a few of the patterns do not obey this symmetry.
The identification of candlesticks and patterns are based on certain algorithmic premises and their details are explained in “Pattern Requirements and Flexibility” subtitle on candlestick pages. All the doji, spinning tops and high waves are treated as different elements of the general Doji family. The algorithm assigns a specific stop loss level and a unique confirmation level to each identified pattern. Only the reversal patterns are taken into consideration in this system, the continuation patterns are omitted.
Use of Candlesticks
Single candlesticks give valuable information about the psychology and underlying price dynamics of the market, especially when they are interpreted in the light of all the possible news and fundamental facts about a security. Candlesticks observed at significant support and resistance levels particularly deserve serious consideration as bullish or bearish reversal signals. However, due attention to the direction of the prior trend is always warranted.
Experienced technical traders prefer to rely more on patterns of two or more successive candlesticks rather than single candlesticks in assessing the likelihood of a reversal. Successful trading also requires waiting for the confirmation of a pattern before an act of buying or selling, even in cases in which the patterns have a high success ratio of reversal prediction. This patience is required because sometimes a pattern can emerge as a result of a very short trend or a horizontal move and it may never be confirmed. In such cases of non-confirmation, it is better to wait in order to avoid a losing trade and until the emergence of a new pattern (if the stop loss was not triggered during this period).
So light on now, no more green and red strokes meet the candlestick
(Credit:Future Pip Media Department and bulls.com)
MICHAEL N.L LAMPTEY
e-mail: [email protected]
t: +233 241 440 394
skype: micnn1
facebook: https://www.facebook.com/mlamptey1
 2014-10-10 134551
 We’ll protect state wealth from opaque deals – Prof Jane Naana
 Mauritania president says running for second term in June polls
 I won't ever say I was a mere driver’s mate' — Prof. Opoku-Agyemang
 2024 polls: 'EC struggling to defend credibility'— Prof. Opoku-Agyemang
 Akufo-Addo gov't's 'greed, unbridled arrogance, unrestrained impunity, sheer dis...
 Election 2024: Ghana needs an urgent reset, a leadership that is inspiring – Ma...
 Partner NDC to rollout a future of limitless prospects – Prof Jane Naana Opoku-A...
 NPP will remain in gov’t till Jesus comes — Diana Asamoah
 Sunyani Technical University demands apology from former SRC president over sex-...
 'Dumsor' was resolved by Mahama but ‘incompetent' Akufo-Addo has destroyed the g...
