
Regions
- Home
- Greater Accra
- Central Region
- Western Region
- Ashanti Region
- Ghana Districts
- Eastern Region
- Volta Region
- Brong Ahafo Region
- Northern Region
- Upper East Region
- Upper West Region

Relevant Links
Media Links
Ghana Upper West Region
INTRODUCTION
Since 1988, Ghana has been operating the decentralized system of development with the District Assembly as the plannin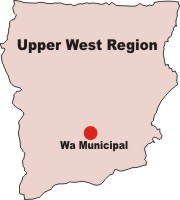 g authority expected to initiate and coordinate the processes of planning, programming, budgeting and implementation of district plans, programmes and projects. The District Assemblies and their constituent organs are also mandated to carry out medium and long term planning that include integration of population policies and issues as they pertain to the needs of particular districts and communities.
This report deals with the five districts of the Upper West Region.
Region:
There are ten administrative regions in Ghana, the same as in 1984.
District:
Ghana changed from the local authorities system of administration to the district system in 1988. The country was demarcated into 138 districts out of the existing 140 local authorities. The boundaries of the districts do not necessarily conform to the boundaries of the local authorities but are coterminous with regional boundaries.
Urban/rural:
The rural/urban classification of localities is population based, with a population size of 5,000 or more being urban and less than 5,000 being rural.
< Background of the region
The Upper West Region, with Wa as the regional capital, was formerly part of the then Upper Region which was itself carved out of the Northern Region in July 1960. In pursuance of the decentralisation policy, the Government, in 1983, divided the Upper Region into Upper East and Upper West.
Physical features
Location and land area
The region covers a geographical area of approximately 18,478 square kilometres. This constitutes about 12.7 per cent of the total land area of Ghana. The region is bordered on the North by the Republic of Burkina Faso, on the East by Upper East Region, on the South by Northern Region and on the West by Cote d’Ivoire. (Figure 1.1)
Vegetation
The region is located in the guinea savannah vegetation belt. The vegetation consists of grass with scattered drought resistant trees such as the shea, the baobab, dawadawa, and neem trees. The heterogeneous collection of trees provides all domestic requirements for fuel wood and charcoal, construction of houses, cattle kraals and fencing of gardens. The shorter shrubs and grass provide fodder for livestock.
Climate
The climate of the region is one that is common to the three northern regions. There are two seasons, the dry and the wet seasons. The wet season commences from early April and ends in October. The dry season, characterized by the cold and hazy harmattan weather, starts from early November and ends in the latter part of March when the hot weather begins, with intensity and ends only with the onset of the early rainfall in April. The temperature of the region is between a low of 150C at night time during the harmattan season and a high of 400C in the day during the hot season.
Political and administrative structure
The region is administered politically from Wa. The main administrative structure at the regional level is the Regional Co-ordination Council (RCC), headed by the Regional Minister. Other members of the RCC include representatives from each District Assembly, regional heads of decentralized ministries, and representatives of the Regional House of Chiefs. The region has five administrative districts namely, Wa, Nadawli, Jirapa-Lambussie, Lawra and Sissala District Assemblies.
A Municipal/District Assembly, headed by a Chief Executive nominated by the President and approved by the Assembly Members, administers each district. Two-thirds of the members of the Assembly are directly elected. The other one-third is appointed by the Central Government in consultation with local leaders.
The districts are autonomous with regards to the planning, budgeting and implementation of projects. In addition, Area/Town Councils/Unit Committees assist in the performance of key roles. There is also effective traditional leadership and vibrant Youth Development Associations to facilitate efficient and effective mobilization of local resources. The region currently has eight political parliamentary constituencies namely, Wa Central, Wa East, Nadawli North, Nadawli South, Jirapa, Lambussie, Sissala and Lawra-Nandom.
Wa West district carved out of the existing Wa district with Wechiau as its capital; Wa East district with its capital at Funsi, and Sissala West district with Gwollu as the district capital.
Cultural and social structures
Ethnic groups
The major ethnic groups in the region fall under the broad generic categories of the Mole Dagbon (75.7%) and Grusi (18.4%). The major languages of the region are Dagaare, Sissali, Wale and Lobi.
Religious affiliation
There are three major religious groupings in the Region, Christianity (35.5%), Islam (32.2%) and Traditional religion (29.3%).
Architecture
The people of the region have a similar style of architecture as that of Upper East. Houses are constructed mainly with mud, with mostly rectangular rooms unlike in Upper East where rooms are predominantly round. The architecture of the region has been influenced by the Larabanga Mosque which was built by the Moslem immigrant traders from Northern Africa, mainly Mali, who later settled in Wa. Because the Christian influence was already strong in the Upper East and Northern Regions at the time, this architectural style could not be passed on to the other areas.
The houses are built in the form of compounds with gates and with walls plastered with mud with cement as the main material of the floor. The rooms are mostly decked with mud, and in certain instances, houses are built up to one storey and roofed with iron sheets or thatch from grass. Most of these locally constructed storey buildings can be found within the chief’s palaces, all over the region.
Festivals
Festivals such as Kobine, Kakube, Zumbeti, Willa, Dumba, Paragbiele, Bagre, Kala, Bongngo and Singma portray the way of life of the people of the region. For instance, the Dumba, which is celebrated by the Walas, is to usher in the New Year. It is at this festival that the Chief is assessed as to his physical fitness to continue to rule his people. During the festival, a live cow is tied and confined to the ground after which the Chief is asked to jump over it without any part of his body or his clothes touching it. If the Chief is able to successfully jump over it, then, it is a clear indication that he would live to continue ruling his people but if he fails, it is a bad omen which presupposes that he would die shortly because he is considered weak and has no long life to rule anymore. The Kokube festival celebrated by the people of Nandom and the Kobine by the people of Lawra have a common significance and are celebrated to offer thanks to God through the ancestors for blessing them with a bumper harvest.
Handicrafts
Culture is not only observed through the celebration of festivals but can be seen also in handicrafts. In Upper West, the people are engaged in spinning, weaving and smock designing. They produce very beautiful musical instruments like the xylophone and engage in pottery, blacksmithing and carving.
Tourist centres
Areas of tourist attraction areas in the region include the Wa Naa’s Palace and Dondoli Sudamic (Larabanga) Mosque, Jirapa Naa’s Palace, Nandom all-stone Gothic Art Church and the Hippopotamus Sanctuary at Wechiau. These apart, areas like the Gwollu Slave Defence Wall and Slave site caves as well as George Ekem Ferguson’s tomb attract tourists to the region.
Demographic characteristics
The region’s total population is 576,583 of whom 276,445 (47.9%) are males and 300,138 (52.1%), females. The region’s population is predominantly rural (82.5%). The dependent population of (>15 and <64 years) is 49.5 per cent. The region’s population forms 3.0 per cent of the total population of the country, while the sex ratio is 92 males to 100 females. The region’s population indicates an increase of 31.6 per cent over the 1984 figure of 438,008, and translates into an intercensal growth rate of 1.7 per cent. The region’s population density of about 31 persons per square kilometre may appear low, but there is a large concentration along the western corridor (Lawra, Jirapa and Nadawli areas) where the density is higher than 97 persons per square kilometre.
Economic characteristics
The main economic activity of the people of the region is peasant farming. This is supported by the fact that 72.2 per cent of the economically active group are engaged in agriculture or related activities. The hard working farmers of the region cultivate maize, guinea corn, millet, yam, rice, soya beans and cotton in addition to the rearing of cattle in large numbers.
DEMOGRAPHIC CHARACTERISTICS
Population size, growth rate and density
Population size
The total population of the region is 576,583. This represents three per cent of the national population. The population of the region is not evenly distributed among the five districts. Wa has the largest population of 224,066, representing 38.9 per cent of the region’s population, while the remaining districts have about 15.0 per cent each.
Growth and density
The region’s population of 576,583 is a 31.6 per cent increase from the figure of 438,000 in 1984. The growth rate of 1.7 per cent between 1984 and 2000 indicates that the region’s population is growing at a slower rate than that of the nation (2.7Per cent). The region has a population density of 31.2 persons per square kilometre. Though this is higher than that of 1984, it is much lower than the national figure of 79.3 but higher than that of the Northern Region (25.9).
Comparatively, the region is larger than the Upper East with regard to land size (approximately 18,478 square kilometres compared to 8,842 square kilometres). However, it has a smaller population, a lower population density, fewer District Assemblies and fewer Parliamentary Constituencies than Upper East.
The country shifted from the Local Authorities system to the District Assembly concept of administration in 1988. With this change, the country was demarcated into 138 districts out of the existing local authorities. It is therefore not possible to derive trend data for the districts. The boundaries of the districts in 2000 do not necessarily conform to the boundaries of the local authorities in 1984 but are coterminous with regional boundaries (Ghana Statistical Service, March 2002).
Age and sex structure
Age structure
The characteristic of the age structure of Ghana is that of a high proportion of children (less than 15 years) and a small proportion of elderly persons (64 years and older). The age structure of the region, which mirrors the national picture, has a broad base (43.4%), representing children younger than 15 years and narrows up at the top with a small proportion (6.1%), representing the population aged 65 years and older.
The age-structure of the population in the districts is examined in broad and sometimes overlapping segments, each of which has implications for the demand for social services, future population growth, youth unemployment, the overall dependency burden, as well as the total labour force of the district.
In every district, at least 13.3 per cent of the population is a child below 5 years. The populations below 15 years fall within the narrow range of 40.5 per cent in Lawra and 44.2 per cent in Wa. This means that in all the districts, about two out of every five persons are children under 15 years of age who are almost entirely dependent on others for their needs. The proportion of the population aged 0-4 years is lower than that of 5-9 years in each district. There is a difference of at least 11.0 percentage points in four districts and 6.0 percentage points in the fifth district, Wa. The youth aged 15-19 years are 9.0 per cent, or slightly higher, in each district. The median age of the population is around 18 years.
The population aged 65 years and older forms a small proportion of the population, ranging from 5.2 per cent in Wa to 7.8 per cent in Lawra, a reflection of the young age structure of the population of the districts.
Age Structure by Sex
The age structure for the sexes shows that although at the regional level there are more females than males, there are variations by age. There are more males than females in the age group 0-19 years. Between ages 20 and 69 years, there are more females than males but this changes again in favour of males for the elderly population, 70 years and older.
The observed age-sex structure at the national level depicts more females than males in almost every age group from age 20 years. The picture is, however, slightly different for Upper West in that males are predominant after age 70 years (Fig. 2.2). This may rather be a reflection of over statement of age for older male respondents or by interviewers since there is hardly any evidence of higher male survival than female at age 70 years and older in the region.
At the national level, females form 50.1 per cent of the population aged seventy years and older. However, in the region, the proportion is 48.1 per cent. The two adjacent regions, Northern (46.6%) and Upper East (47.2%) show similar deviations from the total country picture.
At the district level, the age structures for both sexes mirror the regional pattern. The fact that females outnumber males in the adult age groups may be due partly to out migration of able-bodied men to the southern regions of the country. This has implications for agriculture and food production, given the male domination in land ownership in the region. There are also implications for sexual and reproductive behaviour, even after taking into account the mitigating effects of polygamy.
Sex Composition
The sex composition of the districts favours females. In each district, females form a little over one-half of the population. The proportion of females in the region is 1.6 percentage points higher than the national average. In the region, three districts, Jirapa- Lambussie, Lawra and Nadawli, have slightly higher proportions of females than the regional average of 52.1 per cent.
Sex ratio
The age-sex ratios drop sharply at the regional level, from a high of about 110 males in the age group 15-19 years to below 85 males in the age group 20-24 years. The age-sex ratios remain low till age 40-44 years when they pick up again. The age-sex ratios from the age group 45-49 to the oldest age, pick-up gradually, in a consistent manner except for the dents at ages 50-54 and 60-64 years. The observed pattern of the sex ratios reflects the effect of the sex ratio at birth, and the different patterns of migration and mortality for males and females. At the national level, the drop from age 15-19 to 20-24 is 13.1 percentage points while at the regional level, the drop is 26.2 points (from 109.5 to 83.3).
This is observed in each district. The magnitude of the drop however, varies between districts. The sharpest drop is in Lawra (30.0 percentage points), followed by Sissala (29.2 percentage points). The drop is lowest, 20.6 percentage points, in Nadawli.
Age-sex dependency ratios
Age dependency ratios
The dependent population is measured by the young population (aged less than 15 years) and the aged population (65 years and older). The dependency ratio is therefore defined as the ratio of the sum of the young and aged populations to the active population (aged 15-64 years) expressed as a percentage.
The proportion of the dependent population has declined from 51.3 per cent in 1984 to 49.5 per cent in 2000 and from a dependency ratio of 105.3 in 1984 to 98.2 in 2000. This implies that there are now fewer dependants for the economically active population to support in 2000 than in 1984, although the burden is still relatively high.
A large dependency ratio would increase expenditures, reduce savings and therefore investments. Resources would have to be diverted to maintain the high percentage of dependants instead of being used on capital formation and productive ventures. Life expectancy, which is the average number of years a Ghanaian is expected to live, given the prevailing health and social circumstances, will generally be low. Those on whom so much is spent in the form of education and medical facilities may not live long enough to contribute to development in the future.
If they should contribute to production at all, it may be for relatively short periods. It must be noted that if children under 15 years eventually enter the labour market to search for work, they may increase under employment and unemployment unless the economy expands enough to absorb them through job creation, infrastructure improvement and skills training. The government also spends on pensioners and provides various facilities for children.
Birthplace and migratory patterns
Birthplace
. In the region, about 93.5 per cent of Ghanaians by birth were born in the region. The proportion varies between 76.1 per cent in Nadawli to 91.2 per cent in Jirapa-Lambussie. This implies that migrants into the region constitute between 8.8 per cent and 23.9 per cent of Ghanaians by birth in the districts. The highest proportion of migrants from within the region is recorded in Nadawli (16.9%) and the lowest in Lawra (3.0%). Lawra however, recorded the highest proportion of Ghanaians from other regions and outside Ghana (8.5%).
Migratory patterns
The volume of migration is generally low for both migration within the region and migration from outside the region. Only about seven per cent of Ghanaians by birth are born in different regions or outside Ghana. However, among the migrants, the regional capital district received the highest proportion (43.9 per cent). Nadawli district is the second most attractive destination, accounting for 20.6 per cent of the region’s migrant population. The Sissala district is the third most favoured destination, attracting 16.7 per cent of the migrants. The Lawra district has 10.4 per cent of the migrants. The Jirapa-Lambussie district is the least attractive destination of the migrants accounting for only 8.4 per cent.
The region shares a common border with the Northern Region and the Upper East Region. Data show that proximity of these two adjacent regions does not appear to be a significant pull factor for migration into the districts. Persons born in these two regions and in Upper West account for less than one out of every five migrants from outside the region (19.3%) compared to 27.8 per cent from Ashanti. Almost seventy four per cent of the migrants (73.5 per cent) come from the southern sector of the country and about a third of them from Ashanti. Migrants from other Ecowas countries, other Africa countries and from outside Africa, make up 7.2 per cent of all migrants to the region.
The distribution of the migrants from the other regions to the five districts. Migrants from the Ashanti Region are attracted to all the districts. They constitute 34.6 per cent of migrants in Nadawli, 28.7 per cent in Jirapa-Lambussie, 27.1 per cent in Lawra, 27.0 per cent in Wa. Sissala (20.9%) is relatively the least attractive to migrants from the Ashanti Region. Migrants from Brong Ahafo (18.9%) are not particularly concentrated in any specific district, although they are unevenly spread in the districts; over a quarter (27.7%) in Lawra, about a fifth each in Jirapa-Lambussie (22.2%) and Nadawli (20.3%) and about the same proportion in Sissala (15.9%) and Wa (14.0%). Migrants from the Upper East Region are concentrated mainly in Sissala (21.3%), a border district and to a lesser extent in Wa (8.2%). Those from the Northern Region are mostly found in Wa (19.9%), Sissala (12.2%) and Jirapa-Lambussie (13.1%).
Migrants from the Western region are mainly in Nadawli (16.1%) and Lawra (9.7%) while those from the Greater Accra region are almost evenly distributed in all districts except Nadawli (3.8%). Generally, migrants from all the other regions are broadly spread in all the districts.
Population distribution - rural-urban composition
The region has 17.5 per cent of its total population living in urban localities and is second to the Upper East Region as the least urbanized. There are only six urban localities in the region, almost all located in the regional and district capitals. Although the total urban population is still relatively small, the six urban centres have grown tremendously since 1970. Wa, the regional capital, is the most significant, having grown from 13,740 in 1970 through 36,067 in 1984 to 66,644 in 2000 (84.8% increase). Tumu, the second largest town in the region, grew from 4,366 in 1970 to 6,014 in 1984 (37.8% increase) and to 8,858 in 2000 (47.3% increase). Jirapa also increased by 55.3 per cent from 3,520 in 1970 to 5,466 in 1984 and by 47.5 per cent to 8,060 in 2000. The population of Nandom which was 3,236 in 1970 increased to 4,336 in 1984 (34% increase) and again to 8,060 in 2000 (85.9% increase).
Lawra’s population of 2,709 in 1970 increased to 4,080 in 1984 (5.6% increase) and to 5,763 in 2000 (41.3% increase). Hamile increased by 72.2 per cent from 2,526 in 1970 to 4,349 in 1984 and then by 20.6 per cent to 5,245 in 2000. Wa is the most urbanised district in the region, accounting for about two-thirds (65.8%) of the region’s total urban population. Over a tenth (13.2%) is in Jirapa- Lambussie and 12.2 per cent is in Lawra. Nearly a tenth (8.8%) is in Sissala. Nadawli is entirely rural. All the six urban localities in the region are in four out of the five districts. The Wa District, which is 29.7 per cent urbanised, has only the capital Wa, as an urban locality. Jirapa-Lambussie has two urban localities, Jirapa (8.3%) and Hamile (5.4%). Lawra District also has two urban localities: Lawra (6.6%) and Nandom (7.4%).
SOCIAL CHARACTERISTICS
Household composition and structure There are 80,599 households in the region, which is about 2.2 per cent of the total households in the country. With a population of 576,583, this gives an average household size of 7.2 persons. The total number of houses in the region is 51,898; which gives the average number of 1.6 households per house. Household sizes in the region are high, and the lowest, 6.7 in both Lawra and Nadawli, is higher than the national average (5.1). Household size For the purposes of this report, households are classified into single (1 person), small (2 persons), medium (3-5 persons), large (6-8 persons) and very large (9 persons or more). The most common household in each of the region’s five districts is either the large household, or the very large. The large and the very large household sizes together account for 70.4 per cent of households in Sissala and between 58.3 and 63.2 per cent in the other districts. The medium household size accounts for about a fifth of households in each district but does not exceed 30.0 per cent in any district. Neither the single-person nor the two person households is common in the region. The two categories together constitute only about a tenth (10.0%) of households in each district. Household structure Heads of households constitute 12.5 per cent of the members of households in the region. Temporary heads make up an additional 1.5 per cent of household members. At the district level, the proportion of the population who are heads of households ranges from 11.1 per cent in Sissala to 13.4 per cent in Nadawli, while the proportion of temporary heads ranges from 0.8 per cent in Sissala to 1.8 per cent in Jirapa-Lambussie. Spouses constitute 11.4 per cent of household members, ranging from 9.9 per cent in Lawra to 12.3 per cent in Wa. Children of household heads make up the highest proportion of household membership in all districts. Children of household heads in the region constitute 39.5 per cent of household members, with variations from 41.3 per cent in Nadawli to 36.8 per cent in Sissala. Other relatives Other relatives form the second largest group of household members in the region (23.2%) and in all districts, with the highest proportion (29.5%) in Sissala and the lowest (19.7%) in Nadawli. The traditional external family household composition has not changed much. This is supported by the fact that children, grand children and other relatives of the head constitute a significant proportion of household members (68.4%). Household headship The head of household is generally the person identified by members of the household as the one responsible for the upkeep and maintenance of the household, including the exercise of authority over household resources. The proportion of the household members who are heads of households (including temporary heads) is 14.0 per cent in the region compared to 18.3 per cent for the country. Lawra has the highest proportion of household heads (15.0%), while Sissala has the lowest proportion of both substantive heads (11.0%) and temporary heads (0.8%). While heads of households are predominantly males, temporary heads are mainly females. For the country, 79.3 per cent of temporary heads are females while 68.7 per cent of usual/substantive heads are males. In the region also, the proportion of female temporary heads is 82.1 per cent while the proportion of male heads is 81.7 per cent. In Wa, 79.9 per cent of the temporary heads are females. The proportion of female temporary heads is 71.5 per cent in Sissala the lowest, while in other districts, females comprise between 80.3 per cent and 86.9 per cent of temporary heads. Sex of head of households In the region, majority of households, 81.6 per cent, compared with 86.2 per cent in 1984, are headed by males. 18.4 per cent of households in the region are headed by females compared to 31.3 per cent in the country. The percentage of female-headed households for the country as a whole, has changed very little, from 31.9 per cent in 1984 to 31.3 per cent in 2000. In the Upper West Region however, the proportion of female headed households increased from 13.8 per cent in 1984 to 18.4 per cent in 2000. This is a welcome development in a region where, traditionally, males are almost always the heads of household. The proportional distribution of heads of households by age and sex. The data show that although female household heads are few, their age distribution are fairly similar to that of the male household heads. In the region as a whole, about the same proportion of male and female heads are aged 50 years and older (44.4% male heads and 45.9% female heads). The phenomenon of female household heads may be explained partly by the emerging modern trend of women delaying marriage or staying as single parents. The trend may also be due to breaks in marriage as a result of higher male mortality. The society is polygamous and women marry men far older than themselves. Many women are therefore likely to be widowed. The practice of widow inheritance is gradually declining and widowed women may decide not to remarry or are unable to find suitable husbands. They may therefore decide to maintain themselves and their children as autonomous households. In the region and in all the districts, household heads are mostly in the late adult ages. The median age of household heads is below 50 years. The proportion increases with up to age 50 years, after which it decreases with age. This pattern is the same for all sexes and in all districts. This declining proportion of household headship after age 50 years tends to call into question the perception that the household composition in northern Ghana is characterized by a patriarch as head with married children and their families as members of his household. The observed pattern, on the other hand, may be the result of a better understanding of the household concept leading to a better identification of households. Marital affiliation Never married The population aged 15 years or older who have never married ranges from 25.2 per cent in Nadawli to 28.7 per cent in Lawra. The proportion of never married males is within a narrow range of 34.1 per cent in Wa to 36.9 per cent in Lawra while that of females, which is much lower, falls within a wider range of 16.4 per cent in Sissala to 22.2 per cent in Lawra. Ever married (current and before) There is evidence of early and almost universal marriage in the region, especially for women. This is shown in the fact that, in the region and in each district, 73.8 per cent of persons aged 15 years or older have ever been married. The proportion ever married is below the regional average in only Lawra (71.3%), while in all other districts, the proportion is between 74.1 and 74.8 per cent. More females (81.4%) than males (64.7%) have ever married. The lower proportion of males who have ever married also reflects the fact that men are more likely than women to delay marriage, since traditional practices expect the man to initiate the marriage by paying the bride price and take responsibility for family maintenance, both of which require careful preparation. The region’s total ever married (73.8%), is higher than that of the country as a whole (68.1%). The proportion of males (61.0%) and females (74.9%) ever married, at the national level, are also lower than that of males (64.7%) and females (81.4%) in the region. In each district, the proportion of ever-married females is higher than that for males. Currently married Nearly two-thirds (63.0%) of the region’s population, aged 15 years or older, are married, made up of 58.3 per cent males and 67.0 per cent females. The proportion of males (58.3%) and females (67.0%), married in the region, is higher than in the country, 48.1 per cent males and 51.6 per cent females. In the districts, the population married is higher than 60.0 per cent in four districts and 56.5 per cent in Lawra. Among the males, the proportion married ranges from 54.7 per cent in Lawra to 60.5 per cent in Sissala, while that for females ranges from 58.0 per cent in Lawra to 74.2 per cent in Sissala. Consensual union is not a common practice in the region, being only 1.4 per cent which is much lower than the national average of 6.7 per cent. No longer married In the region, separation, like consensual unions, is not a common practice; only 1.5 per cent of the population aged 15 years or older are reported as separated. This proportion of the population, who are separated in the region is slightly below the total country figure of 1.8 per cent. Slightly more females (1.6%) than males (1.3%), are reported as separated. Only 1.6 per cent of the population aged 15 years or older is reported to be divorced in the region, ranging from 0.8 per cent in Jirapa-Lambussie to 2.2 per cent in Wa. The national figure of 4.8 per cent is thrice that of the region. Less than a tenth of the population of the region (6.3%) is widowed, made up of 2.2 per cent males and 9.7 per cent females. These proportions are higher than the national average of 5.0 per cent (2.1% males and 7.8% females). The proportion of the widowed varies from 4.1 per cent in Sissala to 8.6 per cent in Lawra. The proportion of widowed females is about three times higher than that of males at the regional and district levels. The sex differential in the proportion widowed may be explained by both the higher survival rates of women in the region and the practice of polygamy. In the polygamous marriage, the death of the man results in more than one woman being widowed, whereas the death of a woman in the same polygamous union does not affect the marital status of the man. Another likely explanation of the differential is that men are more likely than women to remarry after the death of a spouse. The high proportion of widowed women has implications for women and their children. The women bear the family burden, childcare, and child welfare against the background of general economic dependency of women and poverty of heads of households in the extended family. Most women are almost entirely dependent on their husbands and generally do not inherit any part of their husband’s property. The death of the breadwinner therefore creates an economic vacuum in the lives of the widow and her young dependent children. Marital status of the population 12-14 years For the country, only 3.8 per cent of those aged 12-14 years are reported as ever married. Ninety two per cent of the males and the same proportion of females, aged 12-14 years, have never married. This is similar to the national situation where 92.9 per cent of population aged 12-14 years, have never married. The proportion of males (93.4%) and females (92.3%) is almost the same. In each district, at least ninety two per cent of those aged 12 years have never married. It is only in Wa that the proportion of the population aged 12-14 years who have ever married (currently or earlier) exceeds 9.0 per cent. Nationality and ethnicity Of the total population of 576,583 enumerated in the region, 95.1 per cent are Ghanaians by birth while 2.9 per cent constitutes naturalised Ghanaians. Other ECOWAS nationals constitute 1.2 per cent whereas African Nationals other than ECOWAS (0.3%) and Non- African nationals (0.5%) account for 0.8 per cent. Ethnicity In the region, there are two predominant ethnic groups, the Mole Dagbon (75.7%) and the Grusi (18.4%). The Wala (16.3%) of the Mole Dagbon and the Sissala (16%) of the Grusi are the major subgroupings in the region. Other indigenous ethnic groupings collectively constitute an additional 5.0 per cent of the population in the region, while all Akan ethnic groups put together constitute 3.2 per cent. There are wide variations within the districts. For example, in Nadowli (91.7%) and Lawra (90.5%), the Dagaabas constitute more than 90.0 per cent of the population. The Dagaabas who are also in the majority in Jirapa-Lambussie (71.8%) constitute the largest single ethnic group in Wa. Although the Sissala make up only 16.0 per cent of the population of the region, they constitute 74.9 per cent of the population of the Sissala District and an important minority ethnic group in Jirapa-Lambussie (13.5%). The Walba (Wala) also make up 16.3 per cent of the region’s population but are concentrated in Wa (40.3%). Religious affiliation There are three main religious groups in the region, Christianity (35.5%), Islam (32.2%) and Traditional (29.3%). There are very marked differences among the districts in relation to religious affiliation. Christians make up the largest religious group in two districts Nadawli (58.5%) and Lawra (56.4%), with a very strong presence in Jirapa-Lambussie (42.5%) and Wa (24.7%). The Islamic religion has most of its adherents in Sissala (70.1%) and in Wa (44.4%). Adherents of traditional religion make up 44.8 per cent of the population in Jirapa- Lambussie, with fairly good presence in Lawra (34.1%), Wa (27.1%) and Nadawli (25.0%). Catholics constitute the majority of Christians in all districts, ranging from 69.3 per cent in Wa to 96.1 per cent in Jirapa-Lambussie. The Pentecostal/Charismatic group is the second largest denomination, after Catholics. Other Christian groups are as important in Wa as the Pentecostal/Charismatic and are second to Catholics in Sissala. Educational attainment and literacy Information on school attendance was collected from all persons 3 years or older. Such information relates to full time education in an educational institution. Such institutions include nursery, kindergarten (pre-school) primary middle, junior secondary, secondary/senior secondary/vocational/commercial, teacher training college, university or similar types of school where a person spends or has spent at least four (4) hours a day receiving general education in which the emphasis is not on vocational skill or trade training. Although the information on school attendance was collected for all persons 3 years or older, the official school entry age in the country is 6 years. Much of the analysis therefore focuses on school attendance of persons age 6 years and older. For the country, the proportion of the population that has ever attended school is 61.2 per cent in 2000, (66.9% of males and 59.5% females). This means that the proportions who have never attended school at the national level is 38.8 per cent (33.1% males and 44.5% females). Comparing these national figures with those for Upper West Region, one observes a very wide gap in the educational attainment between the country as a whole and the region. In the region, 69.8 per cent of the population, aged 6 years and older, have never attended school (65.1% males and 73.9% females). At the district level, Sissala has the highest proportion (75.4%) of the population aged 6 years and older that never attended school (73.1% males and 77.6% females). Lawra has the lowest proportion (65.1%) of the population without formal education (60.3% males and 69.3% females). The low level of education in the region is due not only to general poverty and cultural practices but also to the very late introduction of higher education into northern Ghana. This, in effect, limited education in the north to primary and middle school levels for the older generations and is reflected in the high proportion of those who attained only primary/middle school level in the region. This situation is most likely due to the combined effects of the late introduction of Western education, the influence of Islamic religion, general poverty and other cultural practices. Current school enrolment, in primary one, is still generally lower in the region compared with the national situation for both males and females. Substantial differences also exist between the national and regional pattern at the JSS level. The gross Admission ratio (GAR) is the number enrolled at a first grade divided by the population of the appropriate age group (the official entry age) multiplied by 100. The gross enrolment ratio (GER), in say primary school, is the number of pupils enrolled in P1-P6 divided by the total population of primary school going age (6-11 years) multiplied by 100. Data on current enrolment shows that the gap between boys and girls in school attendance is minimal. At the entry point of both primary (74.5% boys and 75.6% girls) and JSS (36.4% boys and 36.3% girls) the proportions of boys and girls admitted are about equal, but at every level, the proportion of girls progressing to the next grade reduces from one grade to the next, such that there is a widening (though small) gap between boys and girls. Educational attainment For the population aged six years and older who have ever attended school, 45.1 per cent attained primary level, 23.8 per cent attained middle/JSS, and about one in eight (12.8%) attained Secondary/SSS. About five per cent attained each of the other levels: vocational/technical/ commercial (5.6%), post-secondary (5.6%), and tertiary level (5.2%). The rather large proportion of the educated population of the region attained only primary and Middle/JSS, as the highest level (68.9%). This poses a big challenge for the full implementation of the fCUBE and other education improvement programmes. Data show that in each district, at least 60.0 per cent of those who had ever attended school attained primary or middle/JSS level. The proportion varies from 64.7 per cent in Wa to 74.4 per cent in Nadawli. Within each district, at least 10.0 per cent of those who had ever-attended school attained secondary/SSS level. This proportion ranges from 10.4 per cent in Nadawli to 15.3 per cent in Sissala. The proportion that has vocational/technical/ commercial education ranges from 4.2 per cent of the educated in Sissala to 6.4 per cent in Wa. The proportion that attained post secondary level ranges from as low as 4.3 per cent of the ever-attended school in Nadawli to as high as 6.5 per cent in Wa, where they are above the regional value. The proportion that attained tertiary level ranges from 3.4 per cent in Nadawli to 5.9 per cent in Wa. The proportions are above the regional value of 5.2 per cent in Wa and Lawra. There is a disparity in the level of educational attainment between males and females in the region and in each district. At the regional level, the proportion of females who have ever attended school and attained the level of primary school constitutes 48.0 per cent while that of the males is 42.7 per cent. At the secondary school/SSS level the proportion is 14.1 per cent for males and 11.2 per cent for females, and at the vocational/ technical/commercial level the proportion for both sexes are the same. At the post secondary level, the proportion is slightly higher for males (6.3%) than for females (4.7%) It is noted that at the tertiary level, the proportion of males (5.7%) is slightly higher than that of females (4.6%). After the Middle/Junior Secondary School level, the proportions for females begin to reduce as they progress to the tertiary level. Differences in educational attainment between males and females in the region may be explained by differences in initial enrolment as well as to differences in continuation rates. Since fewer females than males had ever attended school, even assuming the ideal situation of females achieving the same continuation rates as males, there is bound to be fewer numbers of females at each successive level of educational attainment. In the region and in each district, the proportions for females are highest at the pre-school and primary, but lower after the middle/JSS level, as they progress to the tertiary level. In the region, and in each district, the proportion of the educated population (aged 6 years and older) that attained secondary school or higher is lower for females except at the Vocational/Technical/Commercial level where they are the same (5.6%). Of those who have attended school in the region, 29.2 per cent attained secondary school or higher. The proportion for males is 31.7 per cent compared to 26.1 per cent for females. A comparison of the regional and national levels shows that the region and districts have higher proportions than the country as a whole, at secondary school or higher. Literacy At the regional level, the proportion of the population aged 15 years or older that is not literate in any language is 73.4 per cent, which is much higher than the national average of 42.1 per cent. The overall level of illiteracy in three of the five districts (Nadawli, Sissala and Jirapa-Lambussie) is higher than the regional average of 73.4 per cent. The data also show that for the region as well as for each district, illiteracy is higher for females than for males. For females, the level is higher than the regional value in the same districts where illiteracy levels are higher than the regional level. The 2000 Census results show that only 25.4 per cent of the region’s population aged 15 years and older is literate in either English or a known Ghanaian language or literate in both English and a Ghanaian language Since most publications and mass communication are in English, the proportion that is effectively functional is only 24.3 per cent in the region (13.4% in English only and 10.9% in English and a Ghanaian language). In the districts, Lawra has the highest functional literacy level (28.3%), with males at 34.2 per cent and females at 23.7 per cent, followed by Wa 27.5 per cent and Nadawli 21.7 per cent. Sissala (19.7%) and Jirapa-Lambussie (19.5%) have levels of effective functional literacy just below 20.0 per cent. Literacy in a Ghanaian Language is low in the region. The proportion literate in a Ghanaian language (Ghanaian language only 1.1%, and English and a Ghanaian language 10.9%) is only 12.0 per cent. In the districts, this proportion ranges from 4.2 per cent in Sissala to 15.2 per cent in Lawra. Since instruction in schools in Ghana is in both English and a Ghanaian language, the low level of literacy in “a Ghanaian language” in the region may therefore imply that the teaching and learning of Ghanaian languages in schools in the region are not being pursued in a sustainable manner. The differences in the proportion which are effectively functionally literate and the proportions literate in a Ghanaian language may also imply that literacy in the region is acquired mostly in the classroom setting than through the existing adult education or functional literacy programmes.
ECONOMIC CHARACTERISTICS Type of activity 75.4 per cent of economically active persons had worked for at least one day during the reference period. There is no substantial difference between the proportion for males (74.8%) and females (76.0%). About a tenth (9.6%) had a job but did not work. The proportion unemployed constitutes 15.0 per cent, which is higher than the national figure of 12.5 per cent. At the district level, the proportions of those employed or who had jobs but did not work or were unemployed follow the regional patterns closely. In each district, except Wa and Sissala slightly more females than males had worked. The proportion of males who had worked ranges from 65.2 per cent in Lawra to 83.6 per cent in Jirapa-Lambussie. The proportion for females ranges from 66.6 per cent in Sissala to 86.2 per cent in Nadawli. Unemployment is slightly higher for males than for females in the region. The overall level of unemployment is highest in Sissala and Lawra. In the region as a whole, unemployment is higher in the urban areas (18.5%) than in the rural areas (14.3%). It is also higher for females than for males in the urban areas. The proportion is the same for males and females in the rural areas. Urban unemployment is also higher in the region compared to the total country figure of 15.6 per cent. In Wa, unemployment is higher in the urban areas, compared to the rural areas and also higher for females in both the urban and rural areas. In Sissala, the proportion unemployed is about the same in both urban (19.8%) and rural (19.4%) areas. In both urban and rural areas, more females than males are unemployed, with the urban areas recording a larger a differential between males and females. In Lawra and Jirapa-Lambussie, however, unemployment is higher for males than for females in both urban and rural areas. The not economically active (aged 15 years and older) In the region and in each district, females constitute the higher proportion of the not economically active due mainly to the higher proportion of females who are homemakers. Persons who are not economically active are mainly homemakers (32.9%) and students (24.2%). Among this category, males are about twice more likely than females to be students (49.5% males as against 25.6% females). Females are thrice more likely than males to be homemakers (37.7% females 12.7% males). The regional pattern is replicated in each district. The proportion of the not economically active who is students ranges from 28.2 per cent in Sissala to 39.1 per cent in Jirapa- Lambussie. In each district, twice more males than females are students, and there are substantially more females being homemakers than males. About seventeen per cent (17.7%) is not working because of old age. The old age category ranges from 13.9 per cent in the Wa district to 19.9 per cent in Jirapa-Lambussie. In each district, except Sissala, there are more females than males who are not working because of old age. The retired/pensioner group makes up about two per cent of the not economically active population. The proportion ranges from 1.4 per cent in Sissala to 2.6 per cent in Lawra. The proportion not working because of some disability ranges from 2.9 per cent in Sissala to 5.3 per cent in Nadawli, with an average of 4.0 per cent for the region. Age structure of the economically active population (aged 15 years and older) In the region, the total economically active population aged 15 years and older is 241,209 - representing 41.8 per cent of the region’s population. The data show that in the region as a whole, and in each district, there is a large pool of human resources available to work. The economically active are young and thus, available to work for a long period. In the region, as a whole, the proportion of young adults (aged 15-29 years) is 37.3 per cent. In each district also, energetic young adults (15-29 years) constitute at least one-third of the economically active population. The proportion ranges from 33.1 per cent in Lawra to 43.6 per cent in Sissala. The proportion of the population aged 30-44 years and who are likely to have considerable work experience constitutes between 30.2 and 33.2 per cent of the economically active population in the districts. The proportion of the economically active population aged 45-59 years is 18.3 per cent, varying from 14.9 per cent in Sissala to 20.5 per cent in Nadawli. Age specific activity rates The volume of economically active population is normally presented in absolute numbers as a percentage of the total population. The percentage computed as such represents the overall extent of participation of the population in economic activity and is termed crude activity rate or labour force participation rate. This rate is expressed as a ratio of the economically active population to the total population. For the analytical studies in economic activity, however, it is rather essential to compute the activity rate by age since it varies widely by age. The agespecific rate is calculated by dividing the economically active population within a particular age group by the total population that constitutes that specific age group. The age-specific activity rates in relation to the proportion of economically active population in each age group. It can be observed that age groups between 30 and 60 years have activity rates over 80 throughout the five districts. Interestingly, the activity rates for the age-group 60 years and older (which is the retirement age for the formal sector) are relatively high but decline as the age increases. One would hardly expect to have high activity rates associated with the population aged 75 years and older. However, it can be noted that the activity rates are slightly above 50 in three districts, with Jirapa- Lambussie having the highest (57.2). Nadawli has the lowest age-specific activity rate in the region (45.6). This is because, in mainly agricultural areas, the farmers tend to remain active until they are too old to work. The age group 15-19 years also record high activity rates that is fifty per cent or higher in four of the five districts, and below fifty per cent in only Lawra. Occupation The major occupations in the region are Agriculture and related work (72.0%), Production and Transport Equipment work (12.1%), Sales work (5.2%), Service work (4.0%), and Professional, Technical and related work (4.0%). The five, together constitute at least 96.0 per cent of the occupations in each district. In all districts, the order of Agriculture as the number one occupation, is maintained. Production and Transport Equipment work which ranks second at the regional level, retained that position in all districts. Professional and Technical work (the third major occupation region wise) retains the third position in all the districts except Wa where it ranks fourth. Sales work, which ranks fourth at the regional level, maintained this position only in Lawra; it ranks third in Wa and fifth in the remaining three districts. For males, agriculture (77.6%) is the most predominant occupation, ranging from 69.8 per cent in Wa to 86.5 per cent in Sissala. It is followed by Production and Transport Equipment work (7.4%), which ranges from 4.3 in Sissala to 9.4 per cent in Wa. The third occupation is Professional/Technical (5.1%), with 3.5 per cent in Sissala as the lowest and 6.3 per cent in Lawra as the highest proportion. For females, Agriculture is also the top occupation (67.2%), with the lowest proportion in Nadawli (60.8%) and the highest in Sissala (82.0%). It is followed once more by Production/Transport Equipment work (16.4%), varying from 6.7 per cent in Sissala to 30.1 per cent in Nadawli. Unlike males, however, Sales is the third predominant occupation among the females (6.7%), with the highest proportion in Wa (11.2%) and the lowest in Nadawli (2.2%). This once more supports the findings that sales occupation is predominantly an urban phenomenon. For both sexes, the three top occupations account for over 89.0 per cent, 88.5 per cent for males and 90.3 per cent for females in the region. Industry The three major industrial activities at the national level are Agriculture, including Hunting, Forestry and related workers (49.1%), Wholesale and Retail trade (15.2%) and Manufacturing (10.9 %). The three together account for 75.2 per cent of the industrial activities of the economically active population (aged 15 years or older). The three major industrial activities at the regional level are also Agriculture, including Hunting, Forestry and related workers (73.3%), Manufacturing (8.9%) and Wholesale and Retail trade (4.9%), together accounting for 87.1 per cent of industrial activities in the region. The proportion engaged in education in the region (2.9%) is slightly lower than in the country (3.4%). These four are the major industrial activities in each district, with Agriculture as the major industrial activity in all districts and for both males and females. The proportion engaged in Agriculture ranges from 67.7 per cent of the economically active population in Lawra to 85.3 per cent in Sissala. Manufacturing (9.2%) is the second major industry, with the lowest proportion (2.8%) in Sissala and the highest in Nadawli (17.7%). Wholesale and Retail trade is the third major industrial activity in the districts. It accounts for 8.2 per cent of all industrial activities in Wa, down to 1.4 per cent in Nadawli. Education is the fourth major industry in each region. The proportion in this category ranges from 2.2 per cent in Nadawli to 3.6 per cent in Lawra. All the remaining 12 industry groups (“All others”) together make up only 9.9 per cent of industrial activities in the region. The category “all others” reaches 10.0 per cent or more of total industrial activities in only Wa (12.4%) and Lawra (11.5%). The distribution of industry groups by sex shows that the proportion of males in Agriculture related work, is higher than that of females in each district. The same is true for Education. In the other two major industry groups, Manufacturing and Wholesale/Retail trade, the proportion for females is at least twice that for males in each group and in each district. The differences are higher in the Manufacturing industry since pito brewing, sheabutter and groundnut oil extraction are the economic activities in which women are mostly prominent. Nadawli has the highest proportion of females who are in the Manufacturing industry (28.0%), followed by Lawra (21.2%). What is described as “manufacturing” is mostly smallscale cottage industries such as shea nut and other oil and fat extractive industries, brewing of local drinks, black-smithing, metalwork, weaving, etc. Employment status Another important characteristic of the economically active population is their employment status. In the country as a whole, 67.5 per cent of the economically active persons are selfemployed without employees and 5.2 per cent are self-employed with employees. Formal sector employees constitute 15.2 per cent. Less than a tenth (6.9%) are unpaid family workers, apprentices (3.4%) or are domestic employees (0.7%). The employment status of the economically active population aged 15 years or older for the region and districts. In all the districts, 59.3 per cent of the economically active population are self-employed without employees. The corresponding proportion is 55.2 per cent in Wa, 71.1 per cent in Nadawli, 55.4 per cent in Sissala; 60.7 per cent in Jirapa-Lambussie and 60.9 per cent in Lawra. Unpaid family members form the next highest group (28.4%) with proportions ranging from 20.3 per cent in Nadawli to 35.0 per cent in Sissala. The likely explanation of the high proportion of unpaid family workers is that, in this rural agricultural region with about 80.0 per cent working in the informal sector, be it agriculture or small scale manufacturing industries, the household is the production unit with household members as the main source of labour. Even though they may not be paid any specific wages, they benefit in kind, including having a share of farm produce, free accommodation and even free meals. The Employees and the Self-employed with employees (who could be taxed at source) make up less than a tenth in every district except Wa (13.2%) and Lawra (10.9%). Such an employment structure poses a challenge for the effective mobilization of tax revenue, financial assistance and capital mobilization and has implications for any policy on taxation, economic expansion and job creation. Males and females show a similar pattern of employment status with only small differences in favour of males. For the employee in every district however, there are approximately two males to each female employee. There are generally, more female unpaid family workers and domestic employees than males. Institutional sector of employment Most economically active persons, 77.9 per cent, are employed in the private informal sector. The private formal sector employs 16.1 per cent of the economically active population in the region. The proportion in this sector varies from about 10.0 per cent in Nadawli and Jirapa- Lambussie to 19.8 per cent in Lawra. If the private sector (both formal and informal) is to be the engine of growth then it should be harnessed to play a leading role in the growth of the region’s economy. The public sector, including semi public and parastatals, employs only 5.2 per cent of the workers in the region. In the districts, the proportion ranges from 3.2 per cent in Nadawli to 6.8 per cent in Wa. The distribution of workers by institutional sector by sex shows that the private informal sector remains the largest employer of the working population for both males and females in every district. In each district, there are slightly more females than males in this sector. On the other hand there are twice as many males as females, in the public and semipublic/ parastatal sectors. In the other formal sectors, (private formal, NGO/International Organization, and others) males and females are represented in approximately the same proportions in each district. Working children The phenomenon of working children (i.e. engagement in economic activity by children of school going age 7-14 years) is widespread in the region and in the districts. The distribution of working children by occupation, industry, employment status, and institutional sector generally follows closely the pattern of the adult population in each district. It is worth nothing that, on Census Night 2000, a third (33.8%) of children in the region, aged 7-14 years were working; with an additional 4.0 per cent having a job but not working and just under a tenth (9.4%) declaring themselves actively in search of a job. The percentage of working children, aged 7-14 years, varies from 23.6 per cent in Lawra to 40.4 per cent in Jirapa-Lambussie. The economic activity rate of 7-14 year olds varies from 36.0 per cent in Nadawli to 56.9 per cent in Sissala. The relatively high proportion of children 7-14 years that are economically active (47.2%) in the region is also accompanied by a relatively low percentage (33.6%) of children in this age bracket who are in school, varying from a low of 26.8 per cent in Sissala to 42.6 per cent in Nadawli. Over four fifth (85.6%) of the working children were in Agriculture, varying from 79.3 per cent in Nadawli to 92.4 per cent in Sissala. Almost the same percentage were engaged in Services (5.7%) and Production, Transport and Equipment Operators and related labourers (5.8%). In Wa, 85.6 per cent of the children were engaged in Agriculture and related work. One in twenty (5.7%) were Service Workers (5.8%) and 2.7 per cent were Sales Workers, or were in Production, Transport and Equipment and related work. The major activities of the working children in the region are: Agriculture, Forestry and Hunting (86.9%) distantly followed by Private Household Services (3.2%), Wholesale and Retail Trade (3.0%) and Manufacturing (2.9%). |
|
HOUSING AND COMMUNITY FACILITIES
Introduction
This chapter provides information on selected housing characteristics which are helpful in assessing the general socio-economic condition of the households in each district. These characteristics include the stock of houses, type of dwelling unit, ownership status of dwelling unit, tenure, housing conditions (materials of outer wall, roof, and floor), sources of drinking water, main type of cooking fuel, main source of lighting and type of toilet facility available to the household.
Overall, the data show that although home ownership rate is high, the quality of the dwellings owned is generally poor and access to amenities such as toilet facilities, solid and liquid waste disposal facilities are also poor. The chapter also examines the availability of community facilities, such as post office, telephone, health and educational facilities.
Housing characteristics
Housing stock
The region’s population of 576,583 lives in a total of 51,898 residential houses which include any type of shelter used as living quarters such as huts, or group of huts, kiosks, enclosed compound, cargo containers, tents. These are structurally separate and independent places of abode such that a person or a group of persons can isolate themselves from the hazards of the climate such as storms, rain or the sun.
About two-fifths (39.6%) of the housing stock is in Wa, (which also has 38.9% of the population), followed by Jirapa-Lambussie (17%), and Nadawli (16.5%). The rank order of the housing stock follows closely the rank order of the population of the districts.
Sissala again has the highest average household size of 8.4 persons per household, followed by Wa (7.1), and Jirapa-Lambussie (7.1). Nadawli and Lawra both have the lowest average household sizes of 6.7 persons per household each. All the districts except Lawra have slightly less households per house compared with the national figure. However, all the districts have higher populations per house and larger average household sizes than the country as a whole. This is a reflection of the type of architecture in the region where compound houses with several dwelling units within the compound are very common.
Type of dwelling unit
A little above half of the region’s households (52.2%) live in rooms within houses/compounds. Apart from Jirapa-Lambussie which has a much lower proportion of households living in rooms in compound houses (36.7%), the other districts have more than 50.0 per cent of households occupying rooms in compound houses. Wa and Sissala have a much higher proportion of households living in rooms in compound houses (57.1% each) compared with the regional figure of 52.2 per cent.
The region has 21.6 per cent of households occupying separate houses, with the highest in Nadawli (31.5%) and the lowest in Sissala (14.6%). Households occupying semi-detached houses in the region represent 12.0 per cent of all households, which is close to the proportion in all districts (range from 11.2% to 13.7%). The data show that in each district, more than 85.0 per cent of households live in a permanent structure built according to traditional architecture (mostly mud houses with rectangular rooms with poor ventilation). The proportion varies from 85.7 per cent in Jirapa-Lambussie to 99.2 per cent in Lawra.
Ownership status of dwelling units
Within each district, most households reside in dwellings owned by a household member, being purchased by a household member or belonging to a relative who is not a member of the household. This implies that a substantial proportion of households live in dwelling units owned by a relative. These proportions range from 78.0 per cent in Wa to 90.4 per cent in Jirapa-Lambussie.
About 7 per cent of the region’s households live in dwellings owned by other private individuals, that is, non-household members or other relatives. The proportion ranges from 2.8 per cent in Nadawli to 9.7 per cent in Wa. About 5.6 per cent of the households live in dwelling units owned by private employers, public/government and other private agencies. The proportion in this category varies from 3.0 per cent in Jirapa-Lambussie to 7.6 per cent in Wa.
Over three out of every four households live in family owned houses. As family members grow and new households are formed, there will be increasing pressure on room space in these family houses. Secondly, as the districts, especially the district capitals, expand in population, there will be an increase in the number of migrants and other non-family members needing residential units. Private individuals and other property developers should, therefore, be encouraged to invest in housing estate development to meet any eventual demands.
Tenure
A large majority (80.7%) of households in the region live in dwelling units owned by household members. This proportion is higher than what obtains at the national level, where 57.4 per cent of households own the dwelling units. At the district level, the proportion of households owning the dwelling units they occupy ranges from 74.8 per cent in Wa to 88.5 per cent in Jirapa-Lambussie.
In the region, 13.3 per cent pay rent compared to 22.1 per cent at the national level. The proportion of households paying rent in Wa (17.6%) and Lawra (16.5%) are above the regional proportion of 13.3 per cent. The proportion is below 10.0 per cent in the remaining three districts. In the country as a whole, 19.5 per cent live in rent free accommodation, compared to only 5.4 per cent in the region. One per cent of households in the country are perchers, while the corresponding proportion in the region is 0.6 per cent. Both rent free accommodation, and “perching” are above the regional averages in only Wa and Lawra.
Construction materials
Material of outer walls
For purposes of house construction, mud, mud brick or earth (84.2%) and cement (sandcrete) or concrete blocks, (12.1%) are the two main materials for outer walls. The two materials together, account for over 96.3 per cent of materials used in the construction of outer walls in each of the districts.
The category “all others” comprises metal sheet/slate, stone, landcrete, packing cases/bamboo, thatch and any other materials. Among this residual group, thatch is used as the main construction material of outer walls by 2.0 per cent of households in Sissala. Landcrete is used by about 0.5 per cent in Wa, Jirapa-Lambussie and Lawra. The use of mud/mud brick/earth as main material of outer wall reflects the adaptation of the population to the hot environment, and it is also the result of availability and cost of these local materials.
Modern buildings are the most likely to use cement blocks. These buildings are found mostly in the urban centres and are most likely to be those provided by the Public/Government, other private agencies and other private individuals for rent or as official bungalows. It is therefore not surprising that, about 20 per cent of houses with cement blocks/concrete as material of outer wall in the region, is in Wa. This is a reflection of Wa as the most urbanized district hosting the regional capital as well.
Material of floor
In the region, the same two main materials used for the construction of outer walls (i.e. Mud, mud bricks/earth, and cement/concrete) account for 98.0 per cent of materials for the floor of dwelling units as well, with a range between 97.2 per cent in Sissala and 98.5 per cent in Wa.
The most often used material for floor is earth/mud. The proportion of dwellings using this material is below the regional average of 57.7 per cent only in Sissala (38.5%) and Wa (45.6%). About three out of every four dwelling units use earth/mud as the main material of floor in Jirapa-Lambussie (76.7%) and Lawra (74.8%).
Material of roof
The main materials used for roofing are corrugated metal sheets (45.9%), mud-mud bricks (31.7%) and thatch from grass (16.4%). Substantial differences between the districts in the use of these roofing materials. Nadawli has the largest proportion of its buildings roofed with corrugated metal sheets (56.3%), followed by Wa (49.4%).
The proportion of households living in dwelling units roofed with corrugated metal sheets is much below the regional average in Jirapa-Lambussie (36.6%) and Lawra (39.3%) About a third of dwellings in four of the five districts (ranging from 28.8% in Lawra to 36.8% in Wa) are roofed with mud/mud brick, compared with only 13.6 per cent in Sissala. On the other hand, the proportion (39.3%) using thatch from grass in the Sissala district is about twice the regional average (16.4%) and the highest in the region. Nadawli (4.2%) has the lowest proportion of thatch roofed dwellings followed by Wa (7.6%). Other materials (wood/slate/asbestos, cement/concrete, bamboo and roofing tiles) accounting for only 5.9 per cent are not much used in the districts.
Household facilities and amenities
Room occupancy
bout a tenth of the households (9.9%) in the region have one room, with an additional 15.5 per cent having two rooms. About a third (32.5%) of households occupy three or four rooms, while 42 per cent have five rooms or more. The room occupancy pattern is similar for the districts but quite different from the national level, where 61.8 per cent of households have one (38%) or two (23.8%) rooms. There are also more households occupying seven rooms or more in the region (19.6%) than in the country (8.6%).
The proportion of households occupying one room ranges from 5.2 per cent in Jirapa- Lambussie to 15.9 per cent in Wa. The proportion occupying two rooms is lowest (9.6%) in Lawra and highest (19.6%) in Wa. Wa, the regional district capital, thus has the highest proportion (35.5%) of households occupying one or two rooms but has the lowest proportion (31.4%) occupying five rooms or more. Lawra has the highest proportion (51.8%) of households occupying five rooms or more followed by Sissala (45.9%), Nadawli (45.1%) and Jirapa-Lambussie (51.1%).
Assuming the region to be largely polygamous, with head of households and spouses occupying separate rooms and children and other members to be of different sexes, four rooms at a minimum would be needed by a household of 7 or 8. Although the number of rooms occupied has not been matched with average size of household, the fact that over 60.0 per cent of households in all districts, except Wa (45%), occupy four rooms or more may be indicative of no serious problem of overcrowding in most districts; even in Wa the problem of overcrowding is likely to be limited to the Wa township.
Main source of lighting
Nationwide, the kerosene lamp (54.9%) and electricity (43.7%) are the main sources of lighting. In the region, however, 80.5 per cent of households use the kerosene lamp with another 15.3 per cent using electricity. The proportion of households using the kerosene lamp as the main source of lighting is lowest (73.1%) in Wa and highest (88.9%) in Jirapa- Lambussie.
While Wa has the largest proportion of households using electricity (24.1), in Jirapa- Lambussie, only 5.2 per cent of households in the district use electricity as the main source of lighting. Apart from the district capitals, almost all the remaining communities do not have electricity. For example, although only 24.1 per cent of households in the Wa district have electricity, these households represent 61.7 per cent of all the households in the region using electricity.
The availability, accessibility and affordability of kerosene and kerosene lamps are necessary for lighting purposes in the districts of the region and should therefore engage the attention of planners and the local administration. In addition, the programme of rural electrification needs to be intensified as the availability of electricity is not meant only for household lighting and cooking but also for the promotion of industrial and other economic activities, including food preservation.
The use of other sources of lighting (gas lamp, solar energy and others) is less than 3.0 per cent in the region, while the proportion with no sources of light at all is 1.3 per cent, ranging from 0.7 per cent in Nadawli to 2.9 per cent in Lawra.
Main source of drinking water
Drinking water is considered safe or potable if it is obtained from treated pipe borne supply, in or outside the house, or is supplied by tanker service or is obtained from manual or mechanized boreholes.
On the basis of this classification 58.5 per cent of households in the country have access to potable water (42.4% pipe borne water and 16.4% boreholes). In the region, 63.9 per cent have access to potable water, made up of 16.1 per cent pipe borne water and 47.8 per cent borehole. The remaining households depend on wells and other surface natural water sources such as the river, spring, stream, rainwater or a dugout.
The Nadawli district has the highest proportion (60.7%) of households that depend on borehole water, followed by Jirapa-Lambussie (58.2%). Wa has the lowest proportion (34.9%) of households using boreholes, but it also has the largest proportion of households who use pipe-borne water (22.3%). Households depending on natural water sources such as the spring, rainwater, river, and the stream exceed 20.0 per cent in all districts except Jirapa-Lambussie (15.8%).
Main source of cooking fuel
Wood is the main source of cooking fuel in the region (79.8%), with charcoal (16.5%) a distant second. These are also the main sources of cooking fuel in the districts. The use of wood varies from 66.4 per cent of households in Wa to 92.4 per cent in Nadawli. The use of charcoal varies from 4.9 per cent of households in Nadawli to 28.8 per cent in Wa.
The use of kerosene as cooking fuel is about 1.0 per cent of households in each district. Even though kerosene stoves are not very common, one should not be oblivious of the fact that even where wood or charcoal is used, kerosene is often used to provide the initial fire-fuel to light these. The use of kerosene (1.3%), gas (0.7%) and electricity (0.4%) and other sources (0.4%) of cooking fuel is insignificant in the region. Stocks of millet and sorghum, which feature prominently in Upper East, do not seem to be as important in this region. Gas and electricity are not very affordable and accessible to most households in the region. When compared to the total country picture, the use of more efficient and cleaner cooking fuels is higher in the country than in the region.
Each of the two main sources of fuel used for cooking in the region has associated problems. The use of firewood and charcoal is cumbersome, a drudgery and can affect the health of women and children through inhaling of smoke in burning wood or lighting the fire. More importantly, it leads to the depletion of the forest, and with the region’s savannah vegetation, similar to the sahelian vegetation, poses a major problem to attempts at controlling desertification.
The use of charcoal, in the long run, is expensive and also results in similar reductions in the forest cover of the charcoal producing areas. Thus the use of charcoal and firewood has serious implications for the environment. The environmental impact on the population, wildlife and water bodies should therefore be a matter of national concern.
Cooking space
Almost all households in the region (97.1%) have some cooking space within the premises of the dwelling unit. About three-fifths (56.6%) of households in the region use structures specifically set aside for the purpose of cooking, made up of a separate room for exclusive use of the household (43.1%), a separate room shared with other households (8.4%), an enclosure without roof (3.6%) and a structure with roof but no walls (1.5%).
The use of the open space for cooking is also quite common (30.5%), compared to 9.5 per cent that use the bedroom/hall or the veranda of their rooms for cooking. The regional pattern is repeated in the districts. The use of the open space varies from 19.0 per cent in Lawra to 53.3 per cent in Sissala.
Bathing facility
Over four-fifths (83.6%) of households in the region use a space specifically provided for bathing, within the house/dwelling unit, while 2.5 per cent use public bath houses or bathrooms in other houses and 13.2 per cent use the open space around the house/compound. For the districts, Lawra has the highest proportion of households with bathing facilities of any type (89.2%), followed by Nadawli (87.3%), and Sissala with the least bathing facility (76.6%).
The use of public bathhouses by household members is below one per cent in all the districts except Sissala where 6.6 per cent of households use them.
The waste water from almost all the bathing facilities is not disposed of through any sewerage system but collect into shallow dugouts. Pools of black dirty water which facilitate the breeding of mosquitoes can thus be seen around the bathhouses of most houses/compounds, while many bathhouses, public or private, are also covered with green moss.
Waste disposal facilities
Toilet facilities
Toilet facilities are classified into three categories in relation to their location and accessibility. These are facilities in or around the house, facilities in another house, and public facilities. All these facilities can be the flush toilet (W.C), the pit latrine, the KVIP or the bucket/pan latrines. “Toilet facilities in another house (different house)” refers to the situation where the household members use the toilet facility (any type) of other living quarters. Public toilets are for communal or public use (paid or free use).
Only about eleven per cent of households in the region (11.2 per cent) have a toilet facility of any kind provided in the house. This proportion ranges from 9.2 per cent of households in Sissala to 13.7 per cent in Lawra. In Sissala, Nadawli and Jirapa-Lambussie, the proportions of households with a toilet facility of any type in the house are below the regional overage of 11.2 per cent.
Having the water closet (W.C.) in house is not common, given the low availability of piped water in house. Access to flush toilet and its hygienic use is strongly influenced by the continuous supply of piped water into the facility. The proportion of households with flush toilet in house is below 3.0 per cent in the region, and varies from 1.3 per cent in Nadawli to 3.7 per cent in Wa.
About a tenth (9.1%) of households in the region use a toilet facility in another house. This practice is most common in Jirapa-Lambussie (23.5%) and least in Nadawli (0.5%) and Lawra (0.6%). The practice of using the toilet facility in another house is likely to put pressure on these facilities since they are already not adequate for the households within the dwelling units. Pressure on the available toilet facilities in the house is even greater when account is taken of the fact that these toilet facilities, in most cases, have to be shared with other households in the same house. About a tenth (10.1%) of households in the region use public toilet facilities. Wa has the highest proportion (15.1%) of households using a public facility, with the lowest (0.5%) in Nadawli.
There are households which have no toilet facility of any kind available for the use of the household. The household members use the bush or the field or small receptacles that are disposed of indiscriminately in drains, open gutters or in the bush. The picture with regard to toilet facilities is far from satisfactory. Whereas for the country, 20.2 per cent have access to no specific facility by contrast, 69.1 per cent of households in the region have no facility. The lowest proportion of households with no toilet facilities is 63.8 per cent in Wa while the highest is 82.8 per cent in Nadawli.
This is most disturbing, considering the health hazards that this method of disposal of human waste poses to the households in the districts. In a region where people seem to be very much concerned about their privacy during bathing and privacy during cooking, privacy for toilet facilities seems not to be an important issue, even though this poses more serious health and environmental sanitation hazards and problems. In the region, flush toilets are the most exclusive to households. All the others are, in the greater proportion of cases, shared with other households. This is because the WC is more home-based, required flowing water and less likely to be affordable to households in compound houses.
Solid and liquid waste disposal
Liquid waste disposal
In the country as a whole, only 4.5 per cent of households have an adequate facility for liquid waste disposal (i.e. through sewerage system). For the remaining households, the facilities available include a gutter in front of the house (21.1%), on the street/path in front of the house (39%) and the compound of the house (34.6%). The situation is not different for the districts in the region.
In the region, only 2.3 per cent of the households dispose of their liquid waste through the sewerage system. About two out of every three households (67.4%) pour their liquid waste onto the street or outside, and an additional 25.0 per cent pour the waste onto the compound. In all the districts, liquid waste is disposed of largely on the street/outside or in the compound of the house. The proportion using these two means of disposal varies from 88.9 per cent of households in Wa to 96 per cent in Nadawli.
The use of a gutter in front of the house is very much lower in the region (4.8%) compared to the national (21.1%). The use of gutters in the districts ranges from 1.8 per cent of households in Jirapa-Lambussie to 7.9 per cent in Wa. This is most likely due to the fact that most houses/compounds in the region do not have gutters in front of them. Most houses are a cluster of units built into a compound, usually in an open field with footpaths as their main access roads. Gutters are normally constructed as part of streets and roads.
Solid waste disposal
The information refers to the collection and disposal of solid waste (rubbish) generated by members of the household. Six methods of disposal are specified. The method is categorized as “collected” where the solid waste is either collected by authorized or self-appointed collectors. “Burnt by household” implies that the household burns the rubbish, and “Buried by household” is the situation where the rubbish is buried inside or outside the dwelling unit. Disposal at a “Public dump” refers to the situation where the household disposes solid waste at a locally designated place. When the household disposes solid waste indiscriminately in the bush, along streets, at abandoned or uncompleted building sites or riverbanks, the method is termed “Dumped Elsewhere”.
All other method of disposal are put into the category “Other”. In villages, public dumpsites are usually located on the outskirts, quite away from dwelling units. The problem is with towns where these public refuse dumps can be located, in built-up places sometimes in the same premises as public toilets. As with the disposal of human and liquid waste, few houses in the region provide for the adequate disposal of solid waste. It should be pointed out however that the problem of improper solid waste disposal is a national concern and not restricted to the region. For the country as a whole, only 16.5 per cent of households have a means of burning or burying the solid waste they generate. For the majority of households (82.6%), the facility is either a public dumpsite or elsewhere at their convenience.
As with the practice at the national level, most households in the region dispose of their solid waste “elsewhere” at their convenience (65.6%) or at a public dumpsite (21.1%). Only about a tenth (12.9%) of households have a means of burning or burying their solid waste presumably around the house or having it collected for disposal. The regional pattern is repeated in each of the districts.
In Nadawli, as much as 88.3 per cent of households dispose of their solid waste elsewhere at their convenience, which could be a stream or an open gutter or on someone’s undeveloped plot of land, all of which have serious environmental and health consequences. It is only in Sissala that the proportion of households disposing of their solid waste elsewhere is lower than 50.0 per cent (47.6%). Dumping, burning and burying refuse, carry serious health and environmental hazards. Normally, these methods should not have posed health and environmental hazards, but with the proliferation of plastic materials and other toxic waste, burning tends to release highly toxic fumes into the atmosphere while burying does not. Burying also results in the possibility of poisoning the soil, as well as underground and surface water bodies.
Community facilities
Information on specified community services such as health facilities, telephone connections, postal and educational facilities. The availability of such services is a strong indicator of the level of the development of a community. A variety of factors have been found to influence health services utilization and health outcomes. Among these are the availability of health care services, accessibility and the quality of the services. Availability of health services is defined broadly to include a range of several conditions: the availability of the physical health service structure, the availability of appropriate personnel to run the facilities.
Travel time and distance to reach health facilities, are also an important determinant of the use of health care services. Distance and or the time taken to reach a facility can affect the chances of survival of sick people, especially in emergency situations. The Ministry of Health’s, accessibility policy goal is to provide a health facility within a travel distance not exceeding eight kilometres. The quality and accessibility of educational institutions also have great implications for development. In most rural communities, educational facilities are often located at great distance from the communities. Thus, many children have to travel long distances to reach the nearest school. This contributes significantly to the low levels of enrolment and high drop-out rates recorded in most rural areas. Additionally, since most teachers are reluctant to live in relatively deprived areas of the region, most rural schools are also handicapped in terms of the number and quality of teachers.
The free Compulsory Universal Basic Education Programme (fCUBE) seeks to address four main constraints to the provision of good quality universal basic education in the country. The constraints are poor teaching and learning, resulting in poor performance of children throughout the basic education level, inadequate access to educational services, weak management capacity at all levels of education and unsatisfactory financing arrangements for the education sector. The Ministry of Education’s accessibility policy goal is to provide one primary school facility within a radius not exceeding three kilometres and one JSS facility within a radius not exceeding five kilometres.
Post and telecommunication facilities
Post office facilities
All the districts have post offices except Nadawli, which has only a Postal Agency. Jirapa-Lambussie and Lawra have two post offices each. These facilities are located in the six urban centres and not necessarily in the district capitals; this is why Nadawli, which is a district capital, has only a postal agency.
In Wa, for 77.4 per cent of the communities, the nearest post office is more than 20 kilometres away, followed by 71.8 per cent of communities in Sissala. In Jirapa-Lambussie (72.9%) and Lawra (89.3%), however, most communities are within 15 kilometres of a post office.
Telephone facilities
The picture with regard to telephone facilities is not much different from what pertains to post office facilities. This is because before the advent of private commercial communication centres, post and telephone facilities were usually under the same roof. This situation has not changed much in the region, since postal and telephone services were separated into two different companies. Both services have hardly undergone any expansion in the region. The availability of telephone facilities within the locality ranges from 1.3 per cent of communities in Wa to 3.4 per cent of communities in Sissala.
As with post office facilities, in Wa, for almost two out of every three communities (65.1%), the nearest telephone facility is more than 20 more kilometres away, while in Sissala, 62.4 per cent of communities are more than 20 kilometres from a telephone facility. In Jirapa- Lambussie (79.9%), Lawra (93%) and Nadawli (56.1%) however, most communities have the nearest telephone facility within 15 kilometres.
The distribution of telephone facilities in the region is concentrated in the urban centres or in the large towns. For instance, Wa, the regional capital district, accounts for 85.1 per cent of all telephone facilities in the region; of these, 99.1 per cent are concentrated in Wa town. The facilities appear to be more widely distributed in Nadawli, Jirapa-Lambussie and Lawra, even though they are few. This is reflected in the fact that the proportion of communities within five kilometres of a telephone facility is higher in these districts (36.8% in Lawra, 23% in Jirapa-Lambussie and 12.8% in Nadawli) than where there is concentration at one centre (6.3% in Wa and 7.7% in Sissala).
Tele-density (phones per 100 population) is very low in the region (0.3 compared to 0.7 for the nation as a whole and 3.2 in Greater Accra). It is clear that the region is poorly served with telephone facilities. The situation has improved slightly with the introduction of privately owned commercial communication centres, Ghana Telecom pay phone booths, and Areeba mobile phone services. These facilities are however limited in coverage. Only Wa is served by the Areeba and the Ghana Telecom One Touch mobile telephone services. The region therefore needs major expansion in its telecommunication facilities.
Health facilities
The health sector is a very important component of the social system of every nation. There are two basic health care systems in the country and the region; the orthodox Western allopathic type and the traditional mainly herbal practice. The majority of Ghanaians regard the traditional and modern medical systems as complementary and patronize both of them.
The traditional medical system can be grouped into four main types of specialties, namely traditional birth attendants who play the role of midwives, especially in the rural areas, faith healers who operate from religious movements and derive their healing powers through faith in a divine being; fetish priests, including indigenous priests and priestesses of shrines, ritual and cult leaders, and herbalists. In some cases, a blend of spiritual and herbal healing is employed. The orthodox health facilities that are available in the region, which are Government, Mission and privately owned facilities.
The region has ten hospitals, 60 health centres, one health post and three maternity homes. The Government owns 67.6 per cent of the health facilities in the region. Wa has the highest proportion, (32.4%) of health facilities, with the rest distributed fairly evenly among the other districts.
More than half of the available manpower in the region (56.2%) is made up of supporting staff, while professional and auxiliary nurses make up 38.8 per cent. The situation with medical doctors is not encouraging, considering that there are only 13 doctors for a population of 576,583 giving a doctor to population ratio of 44,353. The corresponding figure for nurses is 1,162 persons to a nurse. There is therefore the need for the District Assemblies to create the enabling environment for non-government participation in the orthodox health delivery system.
Distances to nearest hospital facilities
Access to health care facilities is an important indicator of welfare since distance and/or travel time to a health facility can affect the survival chances of a sick person, especially in emergency situations. The Ministry of Health’s accessibility standard is to provide one health facility within a distance not exceeding eight kilometres. On the basis of this standard, the Region has poor access to health facilities. Whereas almost all localities have a traditional healing facility, less than two per cent of the region’s localities have a hospital within the locality and only 11 per cent of localities have a clinic/maternity home facility within the locality.
The Core Welfare Indicators Questionnaire (CWIQ) survey confirms that less than one-fourth of households in the region have access to (orthodox) health services. In addition, only twothirds of the people who reported being ill or injured in the four weeks preceding the survey, sought medical treatment at the health service centres. Satisfaction with the usage of the health service centres is equally low. The main reasons for dissatisfaction were the cost and the distance to the facilities. Most public and private health facilities in the region are located in the regional capital Wa, and rural dwellers have to travel for more than an hour to reach the nearest health centre.
The availability of a hospital facility within the locality ranges from 0.5 per cent of communities in Jirapa-Lambussie to 2.6 per cent of communities in Sissala. In Lawra, 68.2 per cent of communities are within 10 kilometres of a hospital; the proportion is 39.4 per cent in Nadawli and 36.2 per cent in Jirapa-Lambussie. Although Wa is the largest in terms of population, only 15.6 per cent of localities in the district are within 10 kilometres reach of a hospital, while the proportion is 11.7 per cent in Sissala.
Wa and Lawra Districts have three hospitals each and Sissala has only one hospital. Distances to the nearest hospital are therefore clearly affected by differences in both the number of hospitals available and the sizes of the districts.
Distances to the nearest clinic/maternity home
Even though the number of clinics/maternity homes is also insufficient in the region, the situation is far better than with hospitals. In all districts except Wa, between 10.0 and 15.0 per cent of communities have a clinic/maternity home within the locality.
The majority of localities in all districts except Sissala, are a clinic within the community or within a radius of 10 kilometres. The proportion of localities with a clinic/maternity home within 10 kilometres is lowest in Sissala (41.1%) and highest in Lawra (93.0%).
Traditional healing facilities
Every locality in Sissala, Jirapa-Lambussie and Lawra reported the availability of traditional healing facilities within the locality, while almost all localities (99.5%) reported the availability of traditional healing facilities in Wa and Nadawli. As already indicated elsewhere, the majority of Ghanaians regard the traditional and orthodox health delivery systems as complementary and patronise both of them. The individual attention given, the negotiated or flexible payment terms and the easy access to the health care provider make the traditional healing facilities, the first place of call, particularly for the rural population.
Educational facilities
Primary school facilities
The stock of schools, public and private, in the five districts of the region. Wa district has the highest number of all the different levels of schools in the region. About one third (33.8%) of all the educational institutions are in the regional capital district. The district has 41 (or 31.5%) of pre-schools, 136 (or 34.4%) of primary schools, 81 (or 34.3%) of junior secondary schools and 6 (31.6%) of senior secondary schools. Three out of the four tertiary level institutions in the region are in Wa, the regional capital. The other one is based in Tumu, the district capital of Sissala.
In all the districts, except Sissala, less than 40.0 per cent of the communities have a primary school within the locality. Sissala, which is the largest in land area, has only 117 localities and 41 primary schools, but the proportion reporting the availability of a primary school within the locality is 50.4 per cent.
A significant proportion of communities in each district have a primary school within five kilometres. The proportion is a low of 74.3 per cent in Sissala (it is 74.5% in Wa and 79.3% in Nadawli) and a high of 93.4 per cent in Lawra and (90.4%) in Jirapa-Lambussie. Given the tender ages of primary school children, long distances are likely to affect daily school attendance and eventually school continuation rates. The Government and the District Assemblies should make serious efforts to bring primary education closer to communities to facilitate the full implementation of the fCUBE programme.
Distances to the nearest junior secondary school facilities
The availability of a JSS institution within the locality ranges from 17.0 per cent in Wa to 38.6 per cent in Sissala. Since JSS institutions are non-residential, long distances to school are likely to negatively affect daily school attendance and eventually increase dropout rates.
The Ministry of Education’s policy is to site a JSS facility within five kilometres travel radius. The proportion of localities in each district that has met the Ministry’s accessibility standard is 59.6 per cent in Wa, 60.6 per cent in Nadawli and 64.2 per cent in Sissala. Jirapa- Lambussie (83.9%) and Lawra (86.8%) have the largest proportions of localities in this category. In the districts, the proportion of communities for which the nearest JSS is six kilometres or more away, ranges from 13.2 per cent in Lawra to 40.4 per cent in Wa. It is rather unusual that Wa has such a high proportion of schools, six kilometres or more from the localities, since normally, regional capitals are better endowed with facilities than other districts.
Not only has the region not met fully the Ministry of Education’s policy standards on physical accessibility for primary and JSS institutions, but statistics from the Ministry of Education also indicates that many children in the region enter primary school without the kind of preparation that pre-schooling would provide. This therefore calls for efforts to encourage pre-school education in the region.
There are only 130 pre schools in the region. The proportion of trained teachers at the pre school level is higher than in the country as a whole (34.4% in the region compared to 23.9% in the country). However, the distribution of teachers shows that whereas in the country, 18.2 per cent of teachers at the Basic school level teach in pre schools, the proportion in the region is only 8.2 per cent.
The percentages at the JSS level are 30.3 in the country and 33.0 in the region. In terms of the proportion of teachers trained, and the proportion available at each level, the region has higher proportions except at the pre school level. The region appears to be disadvantaged in the number of teachers at all levels. For instance, the 130 pre-schools in the region have a total of 224 teachers, giving an average of two teachers per school. Given that pre-schools are a three-year programme, an average of two teachers would mean understaffing and therefore not have enough time to devote to the children.
At the primary school also, there are 1,609 teachers for 395 schools, with an average of four teachers per school. Here also it would indicate understaffing at a level that consists of six classes. At the JSS level, the 902 teachers in 236 schools giving an average of four teachers per school would appear satisfactory because it has three classes. What is worth noting, though, is that the policy for the JSS and SSS levels is to have subject area teachers rather than class teachers, so that the average of four teachers would be a gross understaffing at the JSS level.
Teachers, therefore, have to handle large class sizes, especially at the pre-school and primary school levels. Given the existing poor educational infrastructure and the class sizes, effective learning and teaching is bound to suffer. In the region as a whole, the pupil to teacher ratio at the pre school level is 1:46. At the district level, the pupil-teacher ratio ranges from 1:33 in Wa to 1: 58 in Jirapa-Lambussie.
At the primary school level, the pupil teacher ratio is 1: 38 in the region. The ratio ranges from 1:32 in Wa to 1:42 in Jirapa-Lambussie. At the JSS level, the pupil teacher ratio is 1:18 in the region. At the district level, the ratio ranges from 1:14 in Wa to about 1:21 in Lawra and Jirapa-Lambussie. If the campaign for higher enrolment, especially of girls, should result in increased enrolment, and the number and quality of teachers as well as the teaching and learning environment should not substantially improve at the same time, the end result would be heavier teacher workload, and poorer pupil-teacher contact.
Distance to the nearest senior secondary school facilities
Senior secondary school facilities are the least available in terms of numbers. There are 395 communities in the region with a primary school in the locality compared with 236 communities with a JSS. However, the JSS/SSS ratio is approximately 11:1 (236 communities with JSS compared with 19 communities with SSS). Inadequate number of SSS facilities may therefore, hamper progression from JSS to SSS. When note is taken of the community secondary schools concept, it is clear that there is much more to do in order to provide sufficient SSS facilities in the region and in the districts.
It is worth noting, however, that senior secondary schools are usually boarding institutions. The number and distances to nearest SSS Institutions are therefore not very critical for determining accessibility. In most cases, accessibility is determined more by costs, competition of individual students and/or parental choice than by the proximity of the institutions
The effects of district size are reflected in the proportion of localities in each district with SSS facilities. Lawra the smallest district, has the largest number (or 3.3%) of communities with an SSS facility within the locality and Wa which is very large, has the smallest number (or 0.5%) of such localities.
SUMMARY OF FINDINGS, CONCLUSION AND POLICY IMPLICATIONS
Summary of findings
The observed variations in the demographic, social and economic characteristics of the districts, on the one hand, and the housing condition and the availability and accessibility of selected basic community facilities on the other hand, need to be seriously considered in all aspects of district specific policy formulation and implementation in the region. These and possible interventions are discussed, after a brief summary of findings.
Demographic characteristics
The region’s population is not evenly distributed among the districts. Wa alone contains about 30.0 per cent of the region’s population, while the other four districts have less than 20.0 per cent each. The age and sex structure of the population is characterised by a high proportion of children under 15 years and a small proportion of elderly persons, 65 years and older. The population, under 15 years varies from 40.5 per cent in the Lawra, to 44.2 per cent in the Wa, District. The proportion of the population in the dependent age groups (0-14 and 65 years and older), which varies from 48.2 per cent in the Lawra District to 50.8 per cent in the Jirapa-Lambussie District, is higher in the region (49.5%) than for the country (46.6%). Fifty eight per cent of the labour force are between 15 and 34 years. In the districts, this proportion varies from 55.1 per cent in the Jirapa-Lambussie District to 61.3 per cent in the Sissala District.
These findings show that each district has a large and youthful labour force, which, if properly managed, can become a great economic asset to the region. Although the sex composition of the population in the region is almost balanced, there is a slight preponderance of females over males in all the districts. Migration flow is very low in the region, with only about 7.0 per cent of Ghanaians by birth born in different regions or outside Ghana. The proportion born in the locality (i.e. non-migrants) varies among the districts, from 76.1 per cent in the Nadawli District to 91.2 per cent in the Jirapa-Lambussie District.
Although the region shares a common border with the Northern and Upper East, Regions, migrants from these two regions account for less than 20.0 per cent of migrants to the region, compared to 27.8 per cent from the Ashanti Region alone. Almost 74.0 per cent of migrants to the region come from the southern sector of the country. With 17.5 per cent of its population living in urban centres, the region is the second least urbanized in the country, and Nadawli District entirely rural. All fertility indicators for the region show a high but declining fertility. Crude birth rates range from 24.7 live births per 1000 population in the Jirapa-Lambussie, to 34.1 births per 1000 in the Wa, District. Total fertility rates range from 3.3 births per woman in the Sissala District to 5.6 births in the Wa District. The mean number of children ever born by women, aged 40-49 years, ranges from 5.4 in the Jirapa-Lambussie, to 6.1 in the Wa, District.
There is evidence of a high child loss in the districts. The survival rates of the children ever born in the districts range from 77.5 per cent in the Wa District to 80.9 per cent in the Jirapa- Lambussie District. The regional capital district Wa, is the most endowed in terms of health and education facilities and yet has the highest fertility indicators and the lowest child survival rate in the region.
Social characteristics
Household sizes are generally large in the district, with the proportion of households with six persons or more, ranging from 59.4 per cent in the Lawra, to 70.4 per cent in the Sissala, District. The head of household is usually a male. The proportion of female-headed households ranges from 15.3 per cent in the Wa, to 24.2 per cent in the Nadawli, District. The observed proportion of female-headed households (18.4%), which is higher than that of 1984 (13.8%), is relatively high for a predominantly rural agricultural region with a culture of male domination.
The composition of households in the region shows that the proportion of heads of households (including temporary heads) varies from 11.1 per cent in the Sissala, to 13.4 per cent in the Nadawli, District; that of spouses ranges from 9.9 per cent in the Lawra, to 12.3 per cent in the Wa, District. Children of the head of household form the highest proportion of household members in each district, varying from 37.5 per cent in the Lawra, to 41.3 per cent in the Nadawli, District. The proportion of grandchildren and other relatives ranges from 27.0 per cent in the Nadawli, to 33.9 per cent in the Sissala, District. The composition of households in the region indicates that the traditional extended family household composition still persists.
The proportion of the population, aged 15 years or older, who have never married, varies from 25.2 per cent in the Nadawli, to 28.7 per cent in the Lawra, District. The corresponding proportions for females vary from 16.4 per cent in the Sissala, to 22.2 per cent in the Lawra, District. The proportion that have never married includes a large number of youths aged 15- 19 years, (83.6% females and 97.0% males) as reported in 1998 GDHS.
The low levels of divorce and separation in the districts is indicative of fairly stable marriages. Although the proportion ever married is higher for females than for males, the proportion currently married is higher for males than for females. The substantial imbalance in the proportion of widowed females is the main explanation for the lower proportion of currently married females. The proportion of females widowed is at least three times higher than that for males in each district.
The three main religious groups in the region, Christianity, Islam and Traditional religion, are almost equally represented at the regional level. There are, however, marked differences however in their distribution and concentration in specific districts. Christians constitute the largest religious group in the Nadawli and Lawra Districts. Islam has most of its adherents in the Sissala and the Wa Districts. Traditionalists are more than 25.0 per cent of the population in four districts but comprise about 45.0 per cent in the Jirapa-Lambussie, and 34.0 per cent in the Lawra, Districts.
Though there has been some progress in the educational attainment in the country and in the region, a substantial proportion of the population in the region (69.8%) have never been to school; the proportion is higher for females (73.9%) than for males (65.1%). The proportion of the population, aged six years or older, who have never been to school, ranges from 65.1 per cent in the Lawra, to 75.4 per cent in Sissala, District. The highest level of education attained by 68.9 per cent of those who have ever attended school is the primary and middle/JSS. With the exception of the pre-school and primary school levels, there are more males than females at every level of educational attainment.
This difference becomes greater at the middle/JSS or higher levels. Nearly three-fourths (73.4%) of the population, aged 15 years or older, in the region are not literate; this is much higher than the national average of 42.1 per cent. Illiteracy is higher among females (78.8%) than among males (66.9%). Literacy in English only, or English and a Ghanaian language, is highest in the Lawra, followed by the Wa, District. Literacy in a Ghanaian language only is very much lower than literacy in English only in the region (1.1% compared to 13.4%). The proportion literate in a Ghanaian language only ranges from 0.4 per cent in the Sissala, to 1.4 per cent in the Wa, District.
Economic Characteristics
The three major occupations in the districts are Agriculture and related work, Sales work (5.2%) and Production and Transport Equipment work (12.1%). Together, the three account for 89.5 per cent of the workforce in the districts, with the highest proportion (72.2%) in Agriculture. The substantial lack of formal sector, office-based bureaucratic occupations, is reflected in the fact that administrative and managerial capacity is extremely limited in the districts, accounting for not more than 0.2 per cent in any district. Clerical and related workers make up 1.6 per cent of occupations in the region, with the highest proportion in the Wa District (2.6%).
The three major industrial activities are Agriculture, including Hunting, Forestry and related work, Wholesale and Retail trade and Manufacturing. Agriculture is the number one industry with proportions ranging from 67.5 per cent in the Lawra, to 85.3 per cent in the Sissala, District.
In all districts, at least 55.0 per cent of the economically active population is self-employed without employees. Unpaid family workers form the second largest group with proportions ranging from 20.3 per cent in the Nadawli, to 35.1 per cent in Sissala, District, compared with only 6.9 per cent at the national level. This implies that, in the region, the household is the main unit for economic activity.
The private informal sector provides employment for almost all the working population. The proportion for this sector ranges from 72.8 per cent in the Lawra, to 86.2 per cent in the Nadawli, and 85.8 per cent in the Jirapa-Lambussie districts. The formal sector (public or private) is a source of employment for only a small fraction of the work force in each district. Within these small numbers, there are twice as many males as females in each district. Unemployment in the region (11.1%), is higher than in the country (7.8%). It is also slightly higher for males (11.6%) than for females (10.7%). Furthermore, the level is also higher in the urban, than in the rural areas. However, in the urban areas, unemployment is higher for females than for males.
Housing condition and community facilities
The region’s population of 576,583 is made up of 80,596 households. There are 1.6 households per house. The population per house is about 11, and the average household size is 7.2 persons. Room(s) in compound houses are the predominant types of dwelling in all the districts. A very high proportion of the households in each district, ranging from 78.0 per cent in the regional capital District Wa, to 90.4 per cent in the Jirapa-Lambussie District, live in dwellings owned by a relative.
The quality of dwellings in the region is generally poor. Mud/ mud bricks are the main materials of outer walls for at least three out of every four dwelling units. About half of all buildings in each district are roofed with thatch from grass, wood or mud/mud bricks. Earth/mud is also used as the main material for the floor in over 60.0 per cent of dwelling units in the Nadawli, Lawra and Jirapa-Lambussie, Districts, while in the Sissala and Wa Districts, at least half of the floors are made with cement/concrete. There are more rooms available to each household in the region than in the country as a whole. For the country, 61.8 per cent of households occupy only one or two rooms compared to 25.4 per cent of households in the region. The proportion of households occupying one or two rooms in the region ranges from 15.4 per cent in the Lawra, to 35.5 per cent in Wa, districts. There are also more households occupying seven or more rooms in the region (19.6%) than in the country (8.6%).
Only 15.3 per cent of households in the region have electricity. Kerosene is the main source of lighting for at least three out of every four households. The proportion of households using the kerosene lamp varies from 73.1 per cent in the regional capital Wa, to 88.9 per cent in the Jirapa-Lambussie District. In the region, about 64.0 per cent of households have access to potable water. About 16.2 per cent use pipe born water or a tanker service and 47.8 per cent use water from boreholes. About ten per cent of households use water from the well for drinking and 13.1 per cent depend on natural water sources such as the spring, river, stream or rainwater. With the exception of Wa (34.9%), in all the other districts, at least 50.0 per cent of households depend on boreholes, ranging from 51.2 per cent in Lawra to 60.7 per cent in Nadawli.
Firewood and charcoal are the two main types of fuel for cooking for at least 95.0 per cent of households in each of the districts. The use of firewood and charcoal has resulted in the everincreasing depletion of the forest cover in the region with the associated negative impact on rainfall and farming. About 57.0 per cent of households in the region use structures specifically set aside for the purpose of cooking. The proportion in this category ranges from 49.4 per cent in the Wa, to 67.7 per cent in the Jirapa-Lambussie, District. The use of the bed room/hall or the veranda for cooking, is highest in the regional capital district, where there is also the largest proportion of households occupying one or two rooms only. Almost one in three households in the region cook in the open (30.5%). The proportion of households in this category varies from 19.0 per cent in the Lawra, to 53.3 per cent in the Sissala, District.
Almost all households in the region (97.5%) have some bathing space within the premises of the housing unit, and 83.6 per cent use a space specifically provided for bathing within the house. The situation in relation to toilet facilities is different. Access to toilet facilities is significantly below the national average. Whereas at the country level 20.2 per cent of households have no access to specified toilet facility, about 70 per cent of households in this region have no toilet facility. Even the regional capital district does not show any significant difference from the regional picture (63.0%) household have no facility. The proportion of households in the other districts with no toilet facility is highest in the Nadawli (82.8%), followed by the Sissala (74.5%) and the Lawra (74.9%). The proportion is lowest in the Jirapa-Lambussie District (59.6%). Only about 11.0 per cent of households in the region have a toilet facility of any type provided in the house, and in a majority of cases, these facilities are shared with other households.
The methods of waste disposal (both solid and liquid waste) are also not environmentally sound. In all the districts, almost all households dispose of their liquid waste onto the street/outside, into a gutter or onto the compound of the house. About two out of every three households dump their solid waste “elsewhere” and about one out of every five households in the region uses public dumpsites. The public dump site is used the least in the Nadawli District (3.4%) and used the most in the Sissala District (41.2%).
The slow progress in the development of social services in the region is highlighted in the fact that post offices, telephones and hospital facilities are available mainly in the district capitals. For example, the Wa District has 32.4 per cent of the available orthodox health facilities in the region. However these are all located in the Wa township; rural dwellers have to travel varying distances to reach the nearest health centre. This has resulted in a situation where rural dwellers have to travel long distances to access these facilities.
The situation in relation to telephone facilities has improved slightly with the introduction of privately operated commercial communication centres, the Ghana Telecom phone booths and mobile phone services. These facilities however, are still limited in geographical coverage Whereas almost every community has a traditional healing facility, Wa district has 32.4 per cent of available orthodox health facilities in the region. Only a few localities in the region have access to a hospital within the community or the Ministry of Health’s accessibility standard of a health facility within a travel distance of eight kilometres. Less than one in eight localities have a clinic/maternity home and about 67.0 per cent have a clinic/maternity home within the same distance.
Educational facilities are also not adequate. With the exception of Sissala (50.0%), less than 40.0 per cent of localities in each district have a primary school facility within the community. Between 40.0 and 59.0 per cent of localities can access a primary school within five kilometres.
There are fewer JSS facilities compared to primary schools in the region. However, at least 60.0 per cent of localities in the region have met the Ministry’s accessibility standard of a JSS within five kilometres radius. The proportions range from 59.6 per cent in the Wa, to 86.8 per cent in the Lawra, District. Senior secondary schools are the least available, in terms of numbers. Since senior secondary schools are usually boarding institutions, the number of and distances to the nearest SSS institutions are not critical for accessibility. In most cases, accessibility is determined more by the individual student’s and /or parental preferences and costs than by the proximity of the institution.
Conclusion
Comparison of demographic indicators at the national and regional levels
The indicators show that the values for most of the demographic characteristics for the region are substantially different from those of the country. For instance, the population density of the region (31.2) is one and half times lower than the national average (79.3), and the national inter-censal growth rate (2.7) is far higher than that of the region (1.7). The age structure of the region differs only slightly from the national picture in terms of the broad age groups 0-14, 15-64, and 65 years and older. The sex ratio is also not much different from the national. The proportion urban in the country (43.8%) is almost three times that of the region (17.5%).
The low level of migration in the region is reflected in the fact that the proportion of those born outside the locality of is 7.0 per cent compared with the national figure of 31.0 per cent. The proportion that has moved within the region (i.e. born in other locality in the region) is about 10.0 per cent for both the country and the region. Movement across regions (born in another region in Ghana) however is three times higher for the country than for the region.
The fertility indicators (CBR, TFR and MCEB) for the region compare favourably with the national average. Child survival, however, is about 10.0 percentage points lower for the region than for the country.
Comparison of socio-economic indicators at the national and regional levels
The region lags behind the country in most indicators of socio-economic development, such as education, literacy and social infrastructural facilities. The proportion of the region’s population aged six years and older, that has never attended school, is 70.4 per cent, which is 1.8 times higher than the total national average of 39.8 per cent. Educational attainment is consistently lower in the region, at every level, compared to the national. Illiteracy is high in the region with variations among the districts. Literacy in English only or in both English and a Ghanaian language, (which effectively is the only functional literacy for most reading materials), is only about 24.3 per cent in the region, compared with 54.5 per cent nationally.
The proportion literate in a Ghanaian Language only (2.5%) in the country, is about twice higher than in the region (1.1%).
Unemployment is higher in the region (11.1%) than in the country (7.8%) in both the urban and the rural areas. Professional/Technical, Administrative, Managerial as well as Clerical occupations are twice as high in the country as it is in the region. Agriculture, on the other hand, is the occupation of more than seven out of every ten economically active population in the region (72.2%), compared with 49.1 per cent at the national level.
The proportion of the economically active population who are employees in the region (7.8%), is half that of the nation (15.2%). The private informal sector accounts for about 79.6 per cent of the workforce population which is almost the same as in the country and the region. The private formal sector in the region (16.1%), on the other hand, is only half that of the national.
Housing quality is far poorer in the region than in the total country. About one out of every two households, nation-wide, lives in houses with mud/mud bricks/earth as the main material of outer wall. In the region, four out of every five dwelling units are built with this material. Electricity is available to only about 15.0 per cent of households in the region while it is about two in five households, nationwide. Toilet facilities show the greatest discrepancy. Whereas only one in five households in the country has no toilet facility, about two out of every three households in the region have no toilet facility.
Comparison of indicators at the regional and districts levels
The values of the indicators show that most of the demographic characteristics of the districts mirror the regional pattern. The age structure of the region is reflected in the age structure of each district. Similarly, sex ratios (males per 100 females) are about the same. They are, however, slightly below the regional value of 92.1 in the Jirapa-Lambussie and the Lawra Districts and above the regional value in the Wa District.
Population sizes are not uniform in the districts. The Wa District alone contains almost 40.0 per cent of the region’s population, while the proportion of the population living in urban areas of the district is almost twice the regional average. The level of population movement into, or within, the region is low, as reflected in the fact that the proportion born outside the locality of enumeration is not significantly different in the districts.
All the fertility indicators observed for the region differ only slightly for the districts except Wa, where all the indicators are higher than the regional average. The proportion of children surviving is low and differs only slightly between the districts. The figures for the regional capital district (77.5%) are only slightly below the regional values (78.6%). Some significant differentials between districts are observed for educational attainment and literacy. For example, literacy in English only for the region (13.4%) is 1½ times that for the Jirapa-Lambussie (9.0%), and that for the Nadawli (8.8%), Districts. On the on the other hand, literacy in English only is higher for the Wa (15.8%) and the Sissala (15.9%) Districts.
The proportion six years and older, in the region, that had never attended school (69.8%), is slightly lower than that for the Sissala (75.4%), and Jirapa-Lambussie (72.8%), compared with the Wa (68.4%), Nadawli (68.9%) and Lawra (65.1%), Districts. The proportion which had never been to school is much lower in the Lawra (65.1%), than the other four Districts. There is evidence of over concentration of essential services in the Wa, District. About onethird of all education and health institutions are located in the Wa District. About a quarter, 24.0 per cent of households in the Wa District use electricity as the main source of lighting compared to the regional average 15.3 per cent in the region. The proportion of households having access to potable water, however is about uniform in all the districts.
Policy implication and interventions
The overall level of development and demographic structure in the country conceals very marked differences between and within regions, districts, rural and urban areas. It was to effectively address the imbalance in development that the decentralization programme was initiated in 1984 with the District Assemblies established to “initiate and coordinate the processes of planning, programming, budgeting and implementation of district plans, programmes and projects” relevant to the needs of particular districts and communities.
All poverty indicators show that Northern Ghana, comprising the Upper East, Upper West and Northern Regions, continues to be the poorest area in the country (Ghana Statistical Service, 2000). The demographic, social, economic, housing condition and community characteristics of the districts need to be taken into account in deciding on the broad areas for policy strategies and interventions in the region as a whole, and each district, in particular. All the measures of fertility indicate continuous child bearing through out the reproductive ages. The region’s child survival rate of 78.6 per cent is 8.1 percentage points lower than the national average of 86.7 per cent. The region’s population growth rate of 1.7 per cent is however much lower than the national rate of 2.7 per cent. This situation is reinforced by the fact that the population is relatively young, with 41.4 per cent aged below 15 years, who would eventually enter the labour market in search of work.
The low levels of non-farm employment and the low levels of exploitation of known natural resources, within the region, cannot sustain the population. The local economy therefore needs to diversify and expand to absorb the ever-increasing labour force. Unemployment, (11.1%), especially urban unemployment (18.5%), in the region, is already high and efforts must be made to reduce, rather than increase, the level.
The generally poor state of infrastructure in the region cannot support a high economic take off and sustained growth. The road net works are poor, while banking facilities, skilled manpower, electricity and water supply for commercial and industrial activities are either inadequate or unevenly distributed. The uneven spatial distribution of dispersed, small settlements also make widespread provision of social services, such as health and education facilities, pipe-borne water, and the distribution of electricity, very expensive and uneconomical.
Household sizes in the region are large. While single (5.0%) and two (5.8%) personhouseholds are few, households with 6-11 members constitute 52.7 per cent, with an additional 9.6 per cent of households, having 12 members or more. The implication is that while small and medium size households are less likely to be a burden, in terms of meeting certain basic necessities of members, it is more likely that large to very large households will experience serious difficulties regarding the adequate provision of the nutritional needs of members. To a greater extent, a large household size can reduce the ability of the household to save or accumulate capital for investment.
This can also affect the ability of households to procure, for their members, higher levels of education that would increase opportunities, for gainful employment and to contribute meaningfully to the development of their community. The analysis also shows that females head one out of every five households in the region. The cultural setting is one in which males are mostly recognised by the household members as being responsible for their upkeep and maintenance, even if in reality the female is maintaining the household. The increase in the proportion of female-headed households, from 13.8 per cent in 1984 to 18.3 per cent in 2000, is therefore a positive development that should be encouraged.
The fact that females are increasingly assuming roles as heads of households does not mean that their role in decision making may also have increased, because the patriarchal system still marginalizes females in diverse ways. This may tend to exclude females from the decision-making process when it comes to the development of their communities. To ensure that the increase in the female household headship goes with increased participation of females in decision making, efforts at empowerment of females should be intensified. Such efforts should include sensitizing the male population to perceive females as partners in decision-making processes in their respective communities.
Illiteracy levels are still relatively high in all the districts. Most of the population, in all districts, either have no education or have only attained pre-school level. Of those who have ever attended school, few have proceeded beyond the middle/JSS level. Since the region has more females than males, one would expect more girls than boys in schools. Generally, at the primary level, there are almost equal numbers of boys and girls but the situation often changes, at the JSS level and beyond, where the drop out rate of girls becomes high. From the JSS level, many girls, in their puberty age, are given out in marriage, and some migrate south to seek jobs and earn a living.
With the rural population of over 70.0 per cent in all the districts, efforts to develop the districts should concentrate on the rural areas where poverty is more serious and not just the district capitals. Thus, poverty reduction programmes should be pro-poor and rural focused to achieve the desired impact.
The low girl-child education in the region cannot be divorced from poverty of parents and the unfortunate perception that investment in the girl-child’s education is a waste of resources. The consequence of this is that girls are withdrawn from the classroom into marriage or to participate in economic activity. It is necessary to improve the economic situation of parents and provide education to change the perception of the value of schooling. The girl-child education can only be improved, at the JSS level and beyond, when the local economy is improved. The local FM radio stations have a crucial role to play in this.
Several policy issues are involved. First the people should be educated on the need to send the girl child to school and have her retained for a better future for the girl, the parents and the entire society. Secondly, existing cultural practices, in relation to the position of women and girls in society, should be critically examined and modified or eradicated. There should be educational programmes to sensitize the public, on the value and benefits of schooling, to give girls the incentives to stay in school and discourage the current high level girl-child school dropout.
The “free Compulsory Universal Basic Education (fCUBE)” programme should be fully implemented in all the districts to expand access to educational opportunities for the large youthful population. The promotion of girls’ education should work towards redressing the imbalance between boys and girls in school attendance, with a view to achieving gender equity in education. Formal sector administrative and managerial occupations make up a low proportion (0.5%) of the total work force in the districts. Majority of the population in the region are engaged in agricultural enterprises that produce low value raw materials. Age specific activity rates are high, including 46.0 per cent of school going age children (7-14 years) and 56.0 per cent of those aged 15-19 years.
In spite of the high activity rates, food sufficiency is a problem. This may be the result of poor land fertility and inefficient production, storage and distribution methods. Policies that will modernise and expand agricultural production, storage, distribution, and consumption of nutritious foods, are therefore necessary. Since the majority of the population are engaged in agricultural enterprises that produce low value raw materials, the District Assemblies should encourage agro-based enterprises that add value and thereby raise the standards of living of the people.
About two out of every three economically active persons in the region are either selfemployed without employees (59.3%) or with employees (7.8%). In the prevailing tax regime, this leaves only a very small proportion of those gainfully employed who can be taxed directly at source. Districts need to formulate and implement policies that will enhance their revenue base, through income generating activities, including the establishment of viable industries alone, or in partnership with other districts or groups of individuals, in the informal sector.
Since the private sector, especially the private informal sector, will continue for some time to be the back bone of the region’s economy, primarily in the development of rural agriculture and small scale manufacturing industries, it is necessary to inject much more resources (technical logistic, skills training and financial) into this sector, particularly the private informal sector. To improve the quality of the housing situation in the districts, the population should be sensitized on the use of improved qualities of local material, such as sandcrete and burnt bricks, which could be relatively cheaper and durable. District Assemblies could take the lead to use such materials in their construction projects.
Access to pipe borne water is relatively high in the districts, primarily because of the efforts of several NGOs to develop boreholes. The fact that about 45.0 per cent of localities in the region do not use very safe sources of drinking water should be a matter of grave concern. The District Assemblies need to invest more of their resources in the provision of bore holes for the remaining communities in the districts. Relatively high proportions of households (69.1% with variation from 63.8% to 82.8%) have no toilet facility or use facilities in other houses. Since this is not a healthy situation, the District Assemblies should therefore encourage and assist communities and individuals to construct more hygienic toilet facilities, such as the KVIP.
The methods of waste disposal, particularly solid waste, are not environmentally sound. The indiscriminate throwing of household waste tends to pollute the environment with serious health consequences, such as malaria, diarrhoea diseases and typhoid. House to house collection of solid waste or the provision of garbage containers that will improve the situation should be encouraged in the districts, particularly in the urban areas. The use of gas for cooking in the districts is very limited. Charcoal and wood are overwhelmingly used.
This has partly caused the depletion of the forest cover in the region and the negative impact on rainfall and farming. In order to halt the rate of deforestation and desertification, through increased use of firewood and charcoal, efforts should be made to introduce gas cylinders of varying sizes to encourage greater use of gas, since in the long run, charcoal is more expensive than gas.
The District Assemblies are expected to initiate and co-ordinate the processes of planning, programming, budgeting and implementation of district plans, programmes and projects. The greatest problem that the districts face in identifying, prioritising and implementing policies and interventions is that the District Assemblies and their constituent organs do not have adequate supporting infrastructure, trained staff, and financial resources. This makes it difficult for them to prepare coherent district development plans and also take charge of initiating, implementing and monitoring integrated programmes, projects and activities. In view of the scarce formal resources of District Assemblies, it is important to encourage the coordination and sharing of resources, between and among districts, as a more viable way of mobilizing resources for their development programmes.
Interventions
Various programmes, projects and activities have been suggested over the years to address the population and development problems of the country. Success has alluded the nation mainly because of lack of commitment to implement the appropriate remedies. The already documented policies, programmes, projects and activities are extensive and comprehensive enough to meet the needs and priorities of individual districts, sub-districts and communities. Careful assessment is therefore needed to identify policies and interventions appropriate to meet their individual needs and circumstances, of districts in the region.
The planning, execution and monitoring of various interventions should be approached through district/community “ownership” strategies. Interventions should also be in phases or stages. Mass education programmes should be pursued with all seriousness before introducing the interventions to sensitize people in the region, about the benefits accruing to the individual and to the community, from each intervention as well as the consequences of not implementing interventions on a sustainable basis.
Programmes, projects and activities that are either “population influencing or population responsive”, include interventions aimed at improving and expanding the health of mothers and children (programmes on breast-feeding, ante-natal care, postnatal care, growth monitoring, child survival, safe motherhood), reduction in the incidence of teenage pregnancy and reduction in incidence of child bearing among women older than 35 years.
Others are the expanded programme of immunization (EPI), family planning service delivery programmes (importation of contraceptives, distribution of contraceptives, sale of contraceptives) training of community-based distributors, training of traditional birth attendants (TBAs). Family Planning IEC programmes encourage and maintain the involvement of males in family planning. Control of sexually transmitted diseases, including HIV/AIDS (training of health workers, IEC on STDs) provides training and understanding on how population and development are related (training programmes, workshops for district level policy makers and implementers, heads of Government departments, traditional leaders etc.)
There are other health improvement programmes for the Physically Challenged and other vulnerable groups, including the improvement of health and welfare services for people with physical disabilities (rehabilitation, counselling, improved health and welfare of the Aged (i.e. Housing for old people, medical needs, recreational programmes) Programmes on the empowerment of women, to improve the role and status of women, through adult literacy programmes, girl-child education and income generating activities for women, should be promoted to enable females participate fully in the development process. The region and each district are a predominantly peasant labour intensive agricultural economy.
Despite this, there is evidence that food production is often not enough to meet demands, resulting in food shortages. Therefore, if agricultural production methods are not modernized, and the district economies not diversified or do not grow rapidly, there will be a constant pool of under employed labour.
Agricultural improvement and food security issues have also been addressed. There are intervention programmes to improve agriculture and food production (extension services, introduction of new varieties of crops). Also included in this category of interventions are agricultural reform or transformation (research into land tenure systems, land use planning, appropriate technology), and food security issues (i.e. Production, storage, distribution of food). Poverty alleviation programmes, broad public health and income generation programmes and the provision of basic community services, need to be implemented to the benefit of the districts in the region, particularly the vulnerable in the districts.
Public Health care interventions include programmes for the expansion and improvement of health, water and sanitation, surveillance, prevention and control of malaria, yaws, oncho, guinea worm, diarrhoea diseases, acute respiratory infections, and mental health. Enhancing rural and urban development through farm settlement schemes and the establishment of small-scale industries, using appropriate technology, are also recommended as effective programmes. In order to effectively protect the forest cover and fight desertification, tree planting programmes should be intensified. In this respect, particular attention should be given to the planting of such drought resistant trees as the cashew, neem, baobao, dawadawa and shea. The practice of preserving groves and forest cover should be demystified and revived.
Educational programmes (provision of schools, teachers bungalows, functional literacy programmes and migration and spatial distribution programmes (creation of growth centres to encourage or discourage people moving to specific towns or villages within the districts) need to be assessed, to identify areas of resource constraints and difficulties, to full implementation of development programmes. Project performance is as vital as monitoring and evaluation of projects, to effective review and upgrading of programme activities.
Programmes that specifically address issues of quality of project inputs and outputs, the effectiveness and efficiency of project implementation agencies and cost-benefit studies, should become an integral components of projects to ensure effective implementation and identification of areas for further improvement. This should involve the collection, analysis and dissemination of population data and population information dissemination programmes (awareness programmes on population problems, will encourage the use of population data).
The training of staff to acquire the skills that encourage and improve routine data collection, analysis and dissemination of routine data, on the activities and programmes of various government and non-governmental organizations, are necessary in addressing development problems. Programmes to improve and expand utilities (i.e. provision of water and sewerage, electricity, etc.) should become integral components of the district specific planning focus.
