
Regions
- Home
- Greater Accra
- Central Region
- Western Region
- Ashanti Region
- Ghana Districts
- Eastern Region
- Volta Region
- Brong Ahafo Region
- Northern Region
- Upper East Region
- Upper West Region

Relevant Links
Media Links
Ghana Upper East Region
INTRODUCTION
Background of the region
Historically, the Upper East Region is part of what used to be the Upper Region (Upper East and Upper West), which was it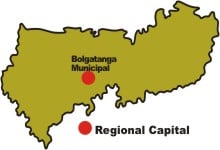 self carved out of what used to be the Northern Region on 1st July, 1960. From 1902 the old Northern Territory was a British protectorate until 1960 when it was separated into the Northern and Upper Region. The Upper Region was later apportioned into Upper East and Upper West in 1983 during the PNDC rule. The process actually started in 1980 when what eventually became Upper West was run on an experimental base as a semi-autonomous region with Wa as the administrative centre, even though the Upper Regional Minister at Bolgatanga exercised overall responsibility.
Physical features
Location and land area
Upper East is located in the north-eastern corner of the country between longitude 00 and 10 West and latitudes 100 30”N and 110N. It is bordered to the north by Burkina Faso, the east by the Republic of Togo, the west by Sissala in Upper West and the south by West Mamprusi in Northern Region (Figure 1). The land is relatively flat with a few hills to the East and southeast. The total land area is about 8,842 sq km, which translates into 2.7 per cent of the total land area of the country.
Soil and drainage
The region’s soil is “upland soil” mainly developed from granite rocks. It is shallow and low in soil fertility, weak with low organic matter content, and predominantly coarse textured. Erosion is a problem. Valley areas have soils ranging from sandy candy loams to salty clays. They have higher natural fertility but are more difficult to till and are prone to seasonal waterlogging and floods. Drainage is mainly by the White and Red Volta and Sissili Rivers (Regional Coordinating Unit, 2003).
Vegetation
The natural vegetation is that of the savannah woodland characterised by short scattered drought-resistant trees and grass that gets burnt by bushfire or scorched by the sun during the long dry season. Human interference with ecology is significant, resulting in near semi-arid conditions. The most common economic trees are the sheanut, dawadawa, boabab and acacia.
Climate
The climate is characterized by one rainy season from May/June to September/October. The mean annual rainfall during this period is between 800 mm and 1.100 mm. The rainfall is erratic spatially and in duration. There is a long spell of dry season from November to mid February, characterized by cold, dry and dusty harmattan winds. Temperatures during this period can be as low as 14 degrees centigrade at night, but can go to more than 35 degrees centigrade during the daytime. Humidity is, however, very low making the daytime high temperature less uncomfortable. The region is entirely within the “Meningitis Belt” of Africa. It is also within the onchocerciasis zone, but with the control of the disease, large areas of previously abandoned farmlands have been declared suitable for settlement and farming.
Political and administrative structure
The region is administered politically from Bolgatanga. The main administrative structure at the regional level is the Regional Co-ordinating Council (RCC), headed by the Regional Minister. Other members of the RCC include representatives from each district assembly, regional heads of decentralized ministries, and representatives of the Regional House of Chiefs. The region has 6 administrative districts3, namely Builsa, Kassena-Nankana, Bongo, Bolgatanga, Bawku West and Bawku East.
Each district is administered by a Municipal/District Assembly headed by a Chief Executive nominated by the President and approved by a two-thirds majority of the Assembly Members present and voting. Two-thirds of the members of the Assembly are directly elected. The other one-third is appointed by the Central Government. Members of Parliament are exofficio members of the Assemblies of the districts in which their constituencies are located. The districts are autonomous with regard to the planning, budgeting and implementation of projects. The Districts are further subdivided into Area/Town Councils/Unit Committees , Talensi-Nabdam (carved out of Bolgatanga) with its capital at Tongo and Garu-Tempane (carved out of Bawku East) with its capital at Garu Tempane, have been created.
with their own designated roles. There is also effective traditional leadership and vibrant Youth Development Associations to facilitate efficient and effective mobilization of local resources. Within the region there are currently twelve (12) political parliamentary constituencies. These are Builsa South, Navrongo Central, Chiana-Paga, Bongo, Bolgatanga, Sandema, Talensi, Nabdan, Zebilla, Binduri, Bawku Central and Garu-Tempane.
Post and telecommunications
Postal services are available in large settlements (Bolgatanga, Bongo, Zebilla, Navrongo, Sandema and Bawku). Telecommunication linkages are also available at Bolgatanga, Navrongo, Sandema Bongo and Bawku. Linkages of district capitals are poor and in some cases not operational e.g. Bongo and Sandema. Private communications centres have sprung up, especially in Bolgatanga, Navrongo and Bawku. Teledensity (phones/per 100 populations is very low in the region (0.1) compared to the national density of 0.7).
Electricity
The towns on the national grid in the region include Bolgatanga, Navrongo, Sandema, Bawku, Zebilla Chuchuliga, Chiana, Pwalugu, Tongo, Kongo, Garu, Bongo and Nangodi.
Energy
Fuel wood for cooking is scarce and the dried stem of sorghum and millet are mostly used for that purpose. The use of liquefied petroleum gas is being encouraged. There is a fuel depot at Bolgatanga for the storage of petroleum products.
Water supply
About 51 per cent of the region’s population have access to potable drinking water. Ghana Water Company Limited (GWCL) supplies pipe-born water to Bolgatanga, Chuchuliga, Zebilla, Bawku, Sandema, Navrongo, Bongo and Paga. Almost two thousand (1,627) hand pumps (boreholes) and a number of hand-dug wells serve a majority of the rural populations. While water treated for consumption in Bolgatanga is from the Vea Dam, the pipe-born water systems in the other townships make use of mechanised boreholes. The dam is also used for irrigation and fish farming.
Health facilities
The orthodox health service in the region is organised in a four-tier system: regional, district, sub-district and community levels. The Regional Health Directorate is responsible for the overall health service planning, organisation, monitoring, supervision, evaluation and provision of technical support to districts. The Regional Hospital located at Bolgatanga is the second level referral centre in the region. There are four district hospitals which provide first level referral services. These are Sandema, the War Memorial Hospital (Navrongo), Zebilla and Bawku Presbyterian Hospital. The Bongo Health Centre is in the process of being upgraded into a district hospital. There are 26 health centres and 36 clinics. There are also maternity homes and nine dressing centres. The region has three Midwifery Schools and one State Registered Nursing School. Navrongo also has a Health Research Centre.
Education facilities
Basic education facilities are available in almost all communities. There are 449 primary Schools, 177 JSS and 23 SSS. Private basic schools are found in Bolgatanga, Navrongo and Bawku.
Housing
The majority of the people live in huts built of mud and roofed with straw or zinc. The main features of the predominantly traditional architecture are round huts with flat roofs and small windows with poor ventilation.
Economic activities
Agriculture
Agriculture, hunting and forestry are the main economic activities in the region. About eighty per cent of the economically active population engages in agriculture. The main produce are millet, guinea-corn, maize, groundnut, beans, sorghum and dry season tomatoes and onions. Livestock and poultry production are also important. There are two main irrigation projects, the Vea Project in Bolgatanga covering 850 hectares and the Tono Project in Navrongo covering 2,490 hectares. Altogether they provide employment to about 6,000 small-scale farmers. Other water-retaining structures (dams and dugouts) provide water for both domestic and agricultural purposes.
Industry
Industrial activity in the region is generally low, with only one industry in operation at the moment. This is the newly built cotton ginnery at Pusu-Namongo (near Bolgatanga). Other existing industries are the Tomato Canning Factory (GIHOC) at Pwalugu, the Meat Processing Factory (GIHOC) at Zuarungu and the Rice Mills at Bolgatanga. These three factories are not operational and have been earmarked for divestiture. The two forms of extractive activities in the region are mining and quarrying. While the quarrying industry is being actively exploited the same cannot be said about the mining industry. There are two commercial quarries in the region namely, the Upper Quarry Limited located at Pwalugu on the Bolgatanga-Tamale road and the Granites and Marbles Company Limited located in Tongo. The former produces granite chippings for the construction industry whilst the latter cuts rocks in the form of bricks for export. These are polished and used in the cladding of commercial buildings and monuments.
The gold mining industry is not very developed in the region. Gold was mined during the colonial administration around Nangodi, about 24 kms from Bolgatanga on the Bolgatanga- Bawku road. Mining activities however stopped in 1930. Lately, small-scale gold mining, popularly known as “galamsey” (gather and sell) or “alakpiri” has become rampant in the area of Tongo, Sheaga, Duusi, Pelengu and other small villages. This gives an indication of the existence of mineral deposits in viable quantities. It is also known that deposits of manganese exist in the areas between Nangodi and Duusi and to the North West of Pwalugu. Small-scale industries constitute the most important industries in the region. This is due to the simple technology involved, the availability of local inputs and linkages between them and other economic activities. These crafts, varied as they are, include, pottery, basketry and smock weaving which is done at areas like Namoo, Zokko, Navrongo and Paga. Leatherworks are carried out at areas around Bolgatanga and the surrounding villages. Straw works are also concentrated around Bolgatanga. One distinct feature of these cottage industries is that they are basically labour intensive and rely mostly on traditional talent and skill.
Tourism
The region is not left out when it comes to sites and scenes of tourist interest. They are numerous tourist attractions in the region, notable among which are the Paga Crocodile Pond, the Bolgatanga Museum which houses objects of historical importance of the region and the Kulungugu Bomb site, where an attempt was made on the life of Ghana’s first President, Dr. Kwame Nkrumah. Others are the three point elevation at Pusiga, where the tip of the boundary demarcation between the three sister countries of Ghana, Burkina Faso and Togo converge, the Tongo hills and the Navrongo Cathedral with its eloquent constructional and decorational designs which portray the beauty in the art of the people.
The archaeological treasures of the River Sissili Basin, the Whistling and Drumming rocks at Pwalugu and Chiana, the Awologo-Tango at Bongo, wall decoration at Tilli, Kandiga, famous shrines and caves also constitute places of culture and tourist attractions. Festivals such as the Feok, Samapiid, Azambene, Gologo, and Fowl are celebrated by the people of Builsa, Bawku East, Bongo, Bolgatanga-Tongo and Kassena-Nankana. These draw a lot of tourists to the region. Sandema in Builsa is famous as the site where Builsa warriors captured and killed the slave mauranders, Samori and Babatu, to mark the end of the slave trade in the northern part of Ghana.
Despite these potentials, the region lacks the necessary infrastructure and other services to support and market this industry. The region will require massive investment to develop this potential and to create jobs.
Development potentials
There is a great potential in the region for the large-scale production of rice especially in the now onchocerciasis (river blindness) free zone. Infact, this zone, which is around Fumbisi- Gbedembillisi area, is normally termed the “rice-bowl” of the region. This area has vast lands and suitable soil, which if properly exploited, would give high yield of rice. The region also has a great potential in the area of cash crop production and fish farming. This is due to the existence of many irrigation sites in the region. In addition to the Vea and Tono irrigation dams, there are more than 220 dams and dugouts in the region, which have lands suitable for crops such as onion, tomatoes and pepper.
Livestock rearing is also a common agriculture activity among the people in the region. The region has about 18 per cent of the cattle and 9 per cent of the small ruminants in the country. There is an annual supply of 50,000 cattle, 40,000 sheep and 40,000 goats to the southern sector for consumption from the region. Poultry is mostly local birds and domesticated guinea fowls. Most of these livestock are kept on an unimproved scavenging regime, although some supplementary feeding is done especially during the dry season. Potential investors therefore have a lot to gain since the region has a great potential for commercial livestock and poultry rearing.
In spite of the relatively developed nature of the mining and quarrying industry, the industry has potential for further development. Potential investors therefore stand to gain from the sector, considering the ‘ready-market’ available and the existence of large tracks of granite rock outcrops especially in Chiana and its environs. This however has to be against the background of a feasibility study with the lifespan of the deposits and a comprehensive environmental impact assessment. It is also known that large deposits of manganese exist in areas between Nangodi and Duusi and to the north west of Pwalugu. No exploitation of this mineral has been carried out yet. Investors could therefore take advantage of this. There is a large prospect in the region for investors wishing to go into brick and tile production because of the availability of large deposits of clay of various types. Areas with clay deposits include Gambibgo, Zanlerigu, Yikini and Kalbeo. Burnt bricks produced from clay deposits can be used in the development of cheaper housing, which is in line with the government’s policy of developing the rural dweller using more local resources. Thus, this should be an incentive to potential investors.
As already indicated, small -scale industries constitute the most important industries in the region. An investment in this sector (especially in basketry, leather works and smock weaving) in the form of the injection of capital would help expand production to meet the growing demand for these crafts outside the country. Markets abound for these crafts in countries such as Britain, Germany and the USA. Already, these constitute a large proportion of non-traditional exports.
Cultural and social structures
Nationality
Ghanaians by birth or parenthood constitute 92.5 per cent of the population of the region. Naturalized Ghanaians constitute a further 5.3 per cent and the rest are non-Ghanaians. There are thus fewer non-Ghanaians (2.1%) than naturalized Ghanaians, constituted of ECOWAS national (1%), other Africa (0.7%) and non-Africa (0.4%).
Ethnicity and languages
The major ethnic groups in Upper East fall under the broad categories of Mole Dagbon (74.5%), Grusi (8.5%), Mande-Busanga (6.2%) and Gurma (3.2%). Among the Mole Dagbon, the major sub-groupings are the Namnam (30.5%), Kusasi (22.6%), Nankani- Gurense (9.2%) and Builsa (7.6%). The Kassena (6.5%) of the Grusi, Busanga (5.9%) of the Mande-Busanga and Bimoba (2.8%) of the Gurma are the other significant ethnic subgroups. The major languages of the region are Gurene (Frafra), Kasina, Nankani, Buile, Kusal, Mampruli and Bisa.
In addition to the 7 major groups, there are several minor ethnic groups in the region. For example, the Bimoba comprise 2.8 per cent of the population in the region but have no concentration in any one district. The Busanga who form 5.9 per cent in the region have major concentrations in only Bawku West (7.8%) and Bawku East (15.4%). The Kusasi make up about one in five of the region’s population whereas the Mamprusis make up less than two percent. However, the Mamprusis are highly concentrated in adjacent West Mamprusi and East Mamprusi of Northern Region.
Other minority groups are the Dargarte (Dagaba) who make up less than one per cent (0.9%) of the region’s population. Their concentration is above the regional percentage share in only two districts, (Builsa, 3.9% and Bolgatanga, 1.7%). It is noted that the Dagarte are indigenes from the Upper West who migrated to settle in this area long before the current regions were created. The Dagombas make up less than one per cent (0.8%) of the region’s population with the highest concentration of 1.7 per cent in the Bolgatanga district. The Vagala with 1.1 per cent of the region’s population has concentration above the regional value in only Bawku West (4.7%) and Bawku East (2.1%).
In all, minority ethnic groups which are not from the southern sector of the country comprise about 10 per cent of the population of the region (10.3%). The presence of the minority ethnic groups in the region has socio-culture implications that have a bearing on ethnic instability in the region, especially in Bawku West and Bawku East. The regional picture, however, changes depending on the base district of the ethnic groups. For instance the Builsa who constitute 7.6 per cent of the region’s population, make up 84.1 per cent of the population of the district.
Religious affiliation
Three main religious grouping are found in the Upper East Region, namely: Christianity, Islam and the Traditional. Traditional religion is the most common form of worship in the region (46.4%), followed by Christianity (28.3%) and Islam (22.6%). About two per cent (1.9%) profess no religious affiliation, and less than one per cent (0.8 percent) belong to other religious groupings. Catholics form the majority of Christians (57.7%) followed by Pentecostal/Charismatic groups (21.7%) and Protestants (12.3%).
For the region as a whole, the proportion of females professing the Christian faith (54.3%) is larger than for males. Indeed, both numbers and proportions for all the Christian denominations and the other religions are larger for females than for males. The Upper East is the only region in which adherents of traditional religion are close to one-half of the population. In the country as a whole, the proportion is 8.5 per cent but in the two adjacent regions, Northern (21.3%) and Upper West (29.3%), the proportions are quite significant. The three northern regions have similar traditional, social and religious practices including ancestor worship and the almost total acceptance of the authority of the clan head.
The duration of exposure to Christianity may not be a possible explanation for the continued adherence to traditional religion. Even in Kassena-Nankana where the White Fathers opened their first mission station at Navrongo in 1906, 55.4 per cent are traditionalists.
Marital affiliation
Information on marital status is applicable to persons 12 years or older. The eligibility for this question is “based on the average age of menarche and also on the practice in some parts of the country where girls as young as 12 years old could be given in marriage” (Ghana Statistical Service, March 2002). Since 92.3 per cent of the population aged 12-14 are never married, however, the data on marital status are presented only for the population 15 years or older.
The data show that in the region as a whole, about three out of every four (75.4%) have been married before. This is made up of 66.6 per cent of males and 82.8 per cent of females.
The proportion widowed is much higher for females (13%) compared to males (3%), a threefold increase. The reasons for this substantial imbalance may be that one woman dying results in only one male widowed in a monogamous marriage or no widow at all if the man is polygamous. On the other hand, one man dying will result in more than one widowed female in a polygamous marriage. “Polygamy is widely practised in the region (36%). Furthermore, the relatively lower proportion of widowed men as compared to women reflects the higher level of mortality among men and also suggests that men are more likely than women to remarry upon the death of a spouse” (Ghana Statistical Service, October 1999). Men also marry relatively younger women and therefore tend to die early, leaving much younger widows who for traditional or cultural reasons may never remarry or much later, if at all.
Literacy
The region show that only 21.2 per cent of the population (15 years and older) are literate in either English only (12.9%), both English and Ghanaian language (6.6%) or Ghanaian language only (1.7%). The regional level of illiteracy (78.1%) is much higher than the national average of 45.9 per cent (Figure 1.3).
Not literate English Ghanaian language Engilsh & Ghanaian Others The majority of the 54.1 per cent of Ghana’s adult population, who are literate in at least one known and written language, have that ability in both English and a Ghanaian language. This observation is true for both males and females. In the Upper East, however, 58.9 per cent of the literate (for both sexes) are literate in English only.
Instruction in Ghanaian schools is in both English and Ghanaian languages. Prior to the new educational reform programme, instruction at the primary school level was largely in Ghanaian languages. In the new system, instructions start in English. The proportion literate in a Ghanaian language (i.e. literate in a Ghanaian language only or literate in English and a Ghanaian language) however is only 8.3 percent. A partial explanation may be that several of the ethnic languages are only spoken and not written. This implies that there is a lot more to do to push the reading and writing of Ghanaian languages in the school system. Since much of literature and mass communication is in English, the effective literacy level is only 19.4 percent. The fact that a little above three in four adults are not literate is unfortunate and must be a challenge to reduce the level.
Educational Attainment
The overall levels of educational attainment are much lower in the region, compared with the country as whole. For instance the proportion of the population aged three years and over that have no schooling or attended only pre-school is 75.7 per cent in the region compared to 47.7 per cent in the country as a whole. When educational attainment is restricted to the population aged 6 years and over, the proportion in the region which has never attended school is 71.8 percent. This proportion is higher for females (76.4%) than for males (66.8%). For the population aged 6 years and over who have attended school before, almost one in two (48.1%) attained primary level. About one in five (20.8%) attained middle/JSS, and about one in eight (12.5%) attained secondary/senior secondary. Less than 5 per cent attained vocational/technical (4.2%) and post-secondary (4.7%). The proportion of males who have attended school before is consistently higher than for females at all levels.
The proportion of the region’s educated population that have primary or middle/JSS as the highest level of education they attained (68.9%) is rather large, and poses a great challenge for the full implementation of the fCUBE and other education improvement programmes. Current school enrolment in Primary 1, however, is generally comparable with the national situation for males and also for females; rather, substantial differences between the national and regional picture persist at the JSS level.
Demographic characteristics
Population size, growth rate and density
The population of the region is 920,089, which is less than one twentieth (4.9%) of the national population. This however is an increase of 19 per cent over the 1984 figure of 722,744, which is the lowest rate of increase among all the regions in the country. The inter censual growth rate of 1.1 per cent per annum is slightly below one-half the national growth rate of 2.7 per cent and is the lowest regional growth rate recorded. The region’s population density of 104.1 persons per square kilometre is higher than the national density of 79.3 persons per square kilometre and ranks fifth in the country.
Rural-urban population
The population is primarily rural (84.3%) and scattered in dispersed settlements. There are generally no distinct boundaries between communities as compounds in contiguous villages over lap. The rural population in 1984 was 87.1 percent. There was, thus, a 2.8 percentage point reduction in the rural share of the population between 1984 and 2000. The slight increase in the urban share of the population has been due mainly to increase in population of existing urban centres. Only 2 towns, Garu and Pusiga have grown from rural to urban localities since 1984. Garu increased from 3,104 in 1984 to 5,057 in 2000, while Pusiga grew from 1,125 to 6,823 over the same period. The largest growth in urban proportion occurred in Bawku (34,074 to 51,379) and Bolgatanga (32,495 to 49,162). Some urban centres however decreased in population (e.g., Navrongo, Paga).
With only 15.7 per cent of the population living in urban areas, the region is the least urbanized in the country. In fact, together with Upper West, they are the two regions with a less than 20 per cent urban population.
As an increasing number of children mature and enter the reproductive years, the number of women in child bearing ages 15-49 years will increase. A large increase in the number of women of childbearing ages inevitably means more children (i.e. in terms of total quantity) even though individual women may give birth to fewer children than their mothers. The simple explanation is that there are just so many more women available to give births. Women of childbearing ages 15-49 comprise 24.9 per cent the total population of the region in 2000, compared with 23 per cent in 1984.
Age structure by sex
The age structure for the sexes shows that in the region, there are more females than males. This, however, varies by age. The proportion of males aged 0-19 years (56.3%) is higher than that for females (49.0%). Between ages 20 and 64 years, there is a higher proportion of females (45.1%) than males (36.8%), while those 65 years and older are 6.8 per cent males compared to 5.9 per cent females. In the female reproductive age group of 15-49 years, there is an overall excess of females (44.3%) over males (39.2%) of about 13.0 percent.
The observed age-sex structure of the region follows very closely the pattern found at the national level where there are more females than males in almost every age group from ages twenty up to seventy-four. It is important to note, however, that although the regional proportions at the various age groups follow the national pattern, there are substantial differences in the magnitude of the proportions between the country as a whole and the region. The higher excess of female in the adult age groups within the region compared to the national picture may be due partly to long-term out migration of able - bodied men to the southern regions of the country and to a lesser extent due to higher male mortality in ethnic conflicts.
The excess of females has implications for agriculture and food production given the known traditional male control of access to land and landownership in the region. The implications of the female excess for sexual and reproductive behaviours should also be a matter of great concern even after taking into account the mitigating effects of the practice of polygamy. For the elderly population (70 years and older), the pattern of more males than females is repeated. The sex ratios reflect the observed pattern which is contrary to the expected pattern of more females than males at the older ages, and may be partly due to exaggeration of age by elderly men. The sex distribution of the region’s population favours females. There are 92.6 males to 100 females, which is a slight increase over the 91.0 males per 100 females in 1984.
Age dependency burden/ratio
The dependency ratio of 99.2 in 2000 for the region is a slight increase from the 96.7 in 1984. The ratio implies that there is roughly one dependent person for every economically active adult. This trend has serious implications for socio-economic planning. The need to provide for the economically dependent persons puts pressure on the resources of the region and individual families. On the whole, children are particularly dependent. They must be housed, fed, clothed, educated and provided with health care and other services that either take a long time to yield dividends or have no immediate bearing on economic growth.
Age structure of labour force
The region has a large and youthful labour force, which, if properly managed, can become a great economic asset. About 56 per cent (55.7 percent) of the labour force is below 35 years.
Nationally the labour force aged 15-34 years shrank slightly from 63.7 per cent of the total labour force in 1984 to 61.1 per cent in 2000, while those aged 35-64 increased between 1984 and 2000.
For the region, also, the labour force aged 15-34 years shrank slightly from 56.4 per cent of the total labour force in 1984 to 55.7 per cent in 2000, while those aged 35-64 increased marginally. These changes in the age structure of the labour force need to be taken into account in formulating short/medium and long-term policies and planned programmes.
Economic characteristics
Type of activity
Occupation
The main occupations in the region in order of magnitude are, agriculture and related work (65.9%), production and transport equipment work (14.5%), sales work (9.5%) service work (3.9%), and professional, technical and related work 3.8 per cent. The five together make up 97.6 per cent of all occupations. The occupational structure of the region is thus not very diverse.
The substantial lack of formal sector, office based bureaucratic activities in the region is reflected in the fact that only 1.7 per cent of the economically active are engaged in administrative, managerial, clerical and related work. About two out of every three are in agriculture (66.4%). The rank order of the five occupations is same for males and females. The proportion of females in sales work (13.3%) is twice that of males (5.8%). The proportion of males in agriculture is 71.8 per cent compared with 61.2 per cent females
Industry
The three major industrial activities at the national level are agriculture, including hunting and forestry (49.1%) wholesale and retail trade (15.2%) and manufacturing (10.9%). Significantly, these remain the three major activities for both sexes in the region.
The proportional shares of the three industry groups in the region are agriculture, including hunting and forestry (67.2%), manufacturing (11.3%) and wholesale and retail trade (9.6%). All the remaining industry groups make up about one eighth (11.9%) of activities in the region, compared with 24.8 per cent at the national level. Education (2.8% for males) and hotels and restaurants (1.8 % for females) deserve mention as the fourth major activities in the region.
Employment status
Another important classification of the characteristics of the economically active population is by employment status.
Almost three in four of the economically active are self-employed without employee (74.5%). Unpaid family workers are the next highest group with 14.0 percent. Employees constitute only 6.5 per cent and the self-employed with employees make up 2.7 percent. Domestic employees or house helps constitute less than one per cent (0.6%). Apprentices and others make up the remaining 1.6 percent.
Employees and the self-employed with employees (who could be taxed at source) make up only 9 percent. Males and females show a similar proportional pattern except for the employee category where there are approximately two males to each female employee.
Employment sector
The private sector, made up of the private formal (21.2%), private informal (74.0%), NGO/International Organizations, and others (0.2%) provides employment to 95.4% per cent of the working population in the region. Only 4 per cent are in the public sector and 0.2 per cent are employed by the semi public/parastatal sector. The size of the private informal sector, made up largely of self-employed persons without employees most of whom are normally not even registered, affects the tax revenue base of the region since direct tax deduction becomes a problem.
Working children (population aged 7-14 years)
A total of 69,094 children of school going aged 7-14 years are reported to be working fulltime. The majority (54.5%) of them are boys. The number of children working represents a little over one in three (34.0%) of the total population aged 7-14 years. The proportion of males of school going age who are working is 35.3 per cent and that of females is 32.7 percent.
The fact that children at these ages are already gainfully employed is a reflection of the extent of child labour in the region. Almost all of these children are engaged in agriculture (77.9%), production and transport equipment (9%), service work (8%) and sales work (4.4%). The working children are almost entirely in the private informal sector and are either selfemployed without employees (63.1%) or are unpaid family workers (29.8%); about five per cent are employees. Contrary to the popular perception that children are used as househelp, child domestic employees make up only 3 per cent while other employees make up 1.7 percent.
DEMOGRAPHIC CHARACTERISTICS
Population size, growth rate and density
The region’s population of 920,089 is not evenly distributed among the six districts.
Growth and density
Intercensal growth rates and changes in population densities between 1984 and 2000 are not available for the districts, because Ghana changed from the local authorities system of administration to the district assembly system in 1988. The country was demarcated into 138 districts out of the existing 140 local authorities. The boundaries of the districts do not necessarily conform to the boundaries of the local authorities but are coterminous with regional boundaries.
Age and sex structure
Age structure
The age structure of the population of the region indicates a broad base that gradually tapers off with increasing age. This regional picture is reflected at the districts level. The age-structures of the districts are examined in broad and sometimes overlapping segments namely: children under fives years (0-4 years), children below 15 years, youth aged 15-19 years, the conventional working force age group of 15-64 years and the conventional aged dependent group of 65 years and older
In every district, about one out of every eight persons is a child below 5 years. The size of each segment has implications for the demand for social services, future population growth, youth unemployment, the overall dependency burden, as well as the total working force of the district. The population below 15 years falls within the range of 40.6 per cent in Kassena-Nankana to 46.4 per cent in Bawku West. The data show that, in all the districts, about two out of every five persons are children who, even granted the phenomenon of working children, are dependent on others for their needs.
The youth aged 15-19 years are between 8 and 10 per cent in all the districts. When the youth are added to the population aged below 15 years, their proportions range from 50.4 per cent in Kassena-Nankana to 54.3 per cent in Bawku West. The median age of the population is thus around 19 years. The population aged 15-64 years is about one half of the total population in each district. The population aged 65 years and above forms the smallest segment and is a reflection of the young age structure of the population of the districts. It is not more than 7 per cent in any district.
The age composition of the population aged 15-64 years shows that each district has a potentially large and youthful workforce (15-39 years), which if properly managed, can become a great economic asset for the region. The private informal sector, especially agriculture and small-scale industries, is the largest source of employment in the region. This sector, therefore, needs to be modernized and injected with capital and technical expertise to enable it diversify its scope of activities to absorb the large numbers of potential job seekers. About two-thirds (64.4%) is young, between 15 and 39 years. In Bawku
East, the proportion is 68.2 per cent while it is 67.4 per cent in Bolgatanga and 64.2 per cent in Kassena-Nankana. The proportions in Builsa (63.5%) and Bawku West (63.8%) are about the same. It is only in Bongo that the proportion of the working force, aged less than 40 years, is lower than 60 per cent (59.4%).
Age structure by sex
The age structure for the sexes shows that at the regional level, there are more males than females at all ages 0-19 years, except for the age group 0-4 years. Between the ages of 20 and 69 years, however there are more females than males. For the elderly population (70 years and over) there are again more males than females. As already indicated, the observed age-sex structure of the region follows, very closely, the pattern at the national level where there are more females than males in almost every age group upwards from age 20 years. The pattern changes for the region after age 70 years where there are more males than females.
The differences in the female/male population from age 20 to 69 are consistently high for the region. At age 70 and older, there is a preponderance of males than females. This is contrary to the observed national pattern of more females at the older ages. At the national level, females constitute 50.1 per cent of the population aged seventy years or more; in the region, the proportion is 47.2 percent. The two adjacent regions show similar deviations from the national picture. Females form 46.6 per cent of the population aged 70 years and older in Northern and 48.1 per cent in Upper West. The fact that these regions are patriarchal and old age and male pre-eminence are greatly respected may probably encourage males to overstate their ages and females understate their ages.
At the district level, the age structures for the sexes follow the regional pattern. The age-sex structure is presented in the population pyramids in the Appendix. The other significant observation about the age-sex structure is that in the adult age group 20-44, the excess of females over males is higher in Bongo (35.8%), Bawku West (35.8%) and Bawku East (29.9%) than what is observed in the region (25.0%) as a whole. The excess of females in the 20-44 age group is lower than the regional value in three districts, Builsa (23.3%), Kassena- Nankana (22.1%) and Bolgatanga (15.2%).
Sex composition and sex ratio
Sex composition
The sex composition of the districts favours females. In each district, females form a little over one-half of the population. The proportion of females in the region is slightly higher than the national average. In the region, three districts, Bongo, Bawku West and Bawku East, have a slightly higher proportion of females than the regional average of 51.9 percent.
Sex ratio
At the regional level age-sex ratios drop sharply from a high of about 110 males in the age group 15-19 years to below 90 males in the age group 20-24 years. The age-sex ratios remain low till age 40-44 years when the ratios pick up again. The age-sex ratios from age group 45-49 to the oldest age, pick-up gradually and in a consistent manner except for the dents at ages 50-54 and 60 - 64 years.
The observed pattern of the sex ratios reflects the effects of the sex ratio at birth, and the different patterns of migration and mortality for males and females. From age 20, ablebodied persons begin to migrate and some may return after age 64. This is reflected in the fact that the sex ratio drops significantly between ages 15-19 and 20-24. For instance, at the national level, there is a sharp drop of 13.1 percentage points from age 15-19 (104.2%) to age 20-24 (91.1%). At the regional level, the drop is 27.9 percentage points (from 109.9% for age 15-19 to 82.0% for age 20-24).
The same pattern is observed in each district. The magnitude of the drop however, differs significantly between districts. The sharpest drop is in Bawku West (46.6 percentage points), followed by Builsa (34.7 percentage points), Bongo (32.6 percentage points) and Bawku East (32 percentage points). In Kassena-Nankana (17.6 percentage points) and Bolgatanga (20.6 percentage point), the drop is below the regional figure of 27.9 percentage points.
Age dependency ratios
The age dependency ratio is influenced by the birth rate. Populations with high birth rates usually have high age dependency ratios because of the large proportion of children age 0-14 in the population. With the dependency ratio of 99.2 (43.4% or the population under 15 and 6.4% aged 65 and older), it means that 100 economically active persons have responsibility for 99 dependants. The pattern for the districts is very interesting. Three districts have fairly low dependency ratios while the other three have extremely high ratios.
Bawku West (116.1), Bawku East (110.0) and Bongo (107.4) have much greater dependency burdens than the regional average while Builsa (94.3), Kassena-Nankana (87.8) and Bolgatanga (86.6) have lighter loads. These have important implications which must be taken into account for socio-economic planning. Bawku West, with the highest age dependency ratio of 116.1 has 46.4 per cent of its population aged below 15 years and only 7.2 per cent aged 65 years and over. In Bawku East where the age dependency ratio is 110.0, the population under 15 years is 45.8 per cent and those 65 years and older is 6.9 percent. Bongo has an age dependency ratio of 107.4 and 44.8 per cent of its population below 15 years. The proportion aged 65 years or older is 6.9 percent.
In Builsa the age dependency ratio is 94.3, and the populations aged below 15 years and aged 65 years and above are 42.3 per cent and 6.3 per cent respectively. Kassena-Nankana has an age dependency ratio of 87.8 and a dependent population of 40.5 per cent below 15 years and 6.1 per cent 65 years and above. Bolgatanga has the lowest age dependency ratio of 86.6. The dependent population is made up of 40.9 per cent below 15 years and 5.5 per cent aged 65 years and above.
The observed ratios imply that there is roughly one dependent person to every economically active adult in each district. The pressure on the economically active population is greatest in Bawku West, Bawku East and Bongo. These have important implications which must be taken into account for socio-economic planning.
Birthplace and migratory pattern
Birthplace
Birthplace and migratory pattern are analysed by comparing locality of birth with locality of enumeration. While some of the persons born in locality of enumeration may have returned after years of migration, it is not possible to isolate them for analysis. Comparing locality of birth with locality of enumeration is only a crude measure of migration because a person born in a place may have migrated out for a very long time to work but found him/herself back at the birthplace on census night for one reason or the other including retirement. It cannot be said that such a person has never migrated because he/she was counted at the locality of birth.
In all the districts, the proportion born in the locality of enumeration (I.e. non migrants) ranges from 86.7 per cent in Bolgatanga to 93.6 per cent in Bawku West. In other words, migrants in the region constitute between 6 and 13 per cent of Ghanaians by birth.
Migration pattern
The volume of migration is generally low for both migration within the region and migration from outside the region. The regional capital district (Bolgatanga) received the highest proportion of Ghanaian migrants (37.2%). Bawku East is the second most attractive destination, accounting for about a quarter (23.9%) of the region’s migrant population followed by Kassena-Nankana with 16.0 per cent of the migrants. Bongo (10.3%), Builsa (6.5%) and Bawku West (6.1%) are the least attractive destinations of migrants. Within districts (except Bongo), more than 90 per cent of migrants are born in Ghana.
It is significant to note that Builsa has hardly any migrants from outside Ghana, Economic and social activities of the district are not the type that attract foreign labour, being almost entirely rural. On the other hand, Kassena-Nankana, Bongo and Bolgatanga which are all quite close or share a common border with Burkina Faso, and Bawku East which shares borders with Togo and Burkina Faso have significant proportions of migrants from ECOWAS countries.
Data show that proximity of the two adjacent regions (Northern and Upper West) does not appear to be a significant pull factor for migration into the districts. These two regions account for only about a fourth (22.7%) of migrants from outside the region. About seven out of ten (69.4%) migrants are from the southern sector of the country, and almost half of these are from Ashanti (32.6%). Migrants from outside Ghana make up 7.9 per cent of migrants.
Migrants from the two adjacent regions (Northern and Upper West) are concentrated in three districts namely, Bolgatanga, Bawku East and Kassena-Nankana. Migrants from Ashanti are also attracted to the same three districts. About a third (29.5%) are in Bawku East, a further 29.4 per cent in Bolgatanga and 17 per cent in Kassena- Nankana. On the whole, migrants from all the other regions in Ghana are also concentrated in the same three districts of Bolgatanga, Bawku East and Kassena-Nankana.
The reasons for the preference of these districts are not far fetched. Bolgatanga contains the regional capital where most of the white-collar jobs, wholesale and retail trade activities are concentrated. Small-scale gold mining activities “galamsey” also draw migrants into the district. Bawku East has Bawku, an ancient trading town and the main entry point into Ghana from Northern Togo and Southern Burkina Faso, as its capital. The district is also famous for onion production and for its market outlets. Kassena-Nankana has several institutions of higher learning, a world-renowned Health Research Centre and a flourishing irrigation project (Tono) that attract migrants with the requisite technical expertise.
Sex distribution of migrants
The overall distribution of migrants shows a higher proportion of females than males in the region and in each district. However, within region of birth categories, there is no consistent pattern of a higher percentage of males or of females.
Population distribution (rural-urban composition)
The region is the least urbanised in the country. Only 15.7 per cent of the population live in urban areas.
Only 2 districts in the region (Bolgatanga and Bawku East) have levels of urbanization above the regional level; one district has a level close to that of the region (Kassena-Nankana), and (Builsa and Bongo) are entirely rural. There are only seven urban centres in the region. Out of the region’s total urban population, the largest proportion of 43.8 per cent is in Bawku East, followed by 34.1 per cent in Bolgatanga, 16.5 per cent in Kassena-Nankana and 5.6 per cent in Bawku West.
Fertility and child survival
Children ever born:
The average number of children born to women at the end of the reproductive period (40-49 years) is an and indication of cumulative fertility of the woman is called completed family size. If fertility remained unchanged for the earlier 30 years or more, completed family size would be equal to total fertility rate. Completed family size however is not an indicator of current fertility because the births to these women occurred in the past at varying times in a period extending about 25 years.
Age-sex distribution:
The age and sex distribution of a population is the result of the combined effect of fertility, mortality and migration. The age distribution however, is not much affected by changes in mortality, because mortality reduction, in general, does not relate to one or more specific age groups but affects the whole population. Thus, it is fertility that is the overriding factor in determining an age distribution. The level and pattern of fertility in the past can be inferred from the census age distribution with reasonable accuracy.
SOCIAL CHARACTERISTICS
Household composition and structure There are 144,382 households in Upper East occupying 88,401 houses. With a population of 920,089, this results in an average household size of 6.4 persons and an average of 1.6 households per house. The average household size for the region is slightly lower than that of the adjacent regions, Northern (7.4) and Upper West (7.2). What is common to these three northern regions however is that they have an average household size larger than the national average of 5.1 persons per household. Builsa has the smallest average household size of 4.9 persons while Bawku East has the largest of 8.2 persons, followed by Bawku West with 6.9 persons. The remaining three districts have an average size of 5.7, much smaller than the regional average of 6.3 persons. Size of households For the purpose of analysis, the households are classified into five categories: single (1 person), small (2 persons), medium (3-5 persons) large (6-8 persons) and very large (9 persons or more). Bawku East has the highest proportion of very large households (40.7%), followed by Bawku West (28.6%); Builsa has the lowest proportion (7.8%) of very large households. In all districts, except Bawku East, the largest proportions of households (31-47%) are of medium size. In each district, about 30 per cent of the households are large (6-8 persons). Small households of two persons range from 4.1 per cent in Bawku East to 9.9 per cent in Builsa. Single person households form about 6 per cent in Builsa, Kassena-Nankana and Bolgatanga, and less than 5 per cent in the Bawku East (3%), Bawku West (4.2%) and Bongo (4.8%). Household relationships Heads of households constitute 14.8 per cent of the membership of households in the region. Temporary heads make up an additional 0.9 per cent of household members. At the district level, the proportion of the population who are heads of households ranges from 11.4 per cent in Bawku East to 19.2 per cent in Builsa, while the proportion of temporary heads ranges from 0.8 per cent in Bawku West and Bawku East to 1.4 per cent in Builsa. Spouses constitute 12.2 per cent of household members, slightly less than the proportion of heads of household. This is an indication of a considerable proportion of single person or single parent households. Children of the heads of households constitute the highest proportion of household members in each district. In the region as a whole, children of head of household constitute 42 per cent of household members. The highest proportion of 44.5 per cent is in Bawku West, while the lowest (33.5%) is in Bongo. Other relatives are the second largest group of household members other than heads of households in the region and in each district; another significant group is grandchildren. The fact that children, grandchildren and other relatives of the head constitute more than 60 per cent of household members supports the view that the traditional external family household composition has not changed much. It also reflects the extent of fostering in the living arrangements of households (Ghana Statistical service, 2002). Household headship The proportion of household members who are heads of households is 14.8 per cent in the region compared to 18.3 per cent for the country. The proportion of household members who are heads of households ranges from 11.4 per cent in Bawku East to 19.2 per cent in Builsa. Temporary headship is not very widespread in the region. It ranges between 4.8 per cent in Kassena-Nankana and 7.2 per cent in Bongo. While substantive heads of households are predominantly male, the reverse is the case with temporary heads. In the country as a whole, 79.3 per cent of temporary heads are females while 68.7 per cent of usual heads are males. This picture is reflected at the regional and district levels, though at lower levels. For the region as a whole, 77.8 per cent of usual household heads are males and this proportion ranges from 88.7 per cent in Bawku East to 64.3 per cent in Bongo. On the other hand, the proportion of female temporary heads is highest in Builsa (94.2%) and lowest in Bongo (59.4%). Females head only about one-fifth (22.2%) of households in the region compared to the rate of about one-third (31.3%) for the country. But in a region where, traditionally, males are almost always the heads of household, this could be a welcome change. It is worth noting that Bongo has both the highest proportion of female household heads (35.7%) and lowest female temporary household heads (59.4%), far exceeding both regional and national levels. Where a female is identified as head of household, it is likely that she may be a single person, a single parent or a widow. This is evidenced in the fact that only 35 per cent of spouses of heads of households are male (it ranges from 1.9% in Builsa to 11.1% in Bongo). Household heads in the region and in all the districts are mostly in the late adult ages. The median age of household heads is below 50 years with the proportion of headship increasing with age up to 50 years. There is a significant drop in the 50-59 age group and continues to decrease with age. The picture is the same for all districts and for both sexes. This declining proportion of household headship after age 50 years would tend to contradict the popular notion that the culture being patriarchal, several generations in a compound look up to the patriarch as head of the residents. It could also reflect a better understanding of the concept of household and therefore a better identification of households within the residential structures. Marital status only 3.8 per cent of those aged 12-14 were reported as ever married. Ninety two per cent of the males and the same proportion of the females aged 12-14 are never married. This is virtually the same as for the region where 92.3 per cent of persons aged 12-14 years are never married. The proportion of males (93.3%) and that of females (92.2%) never married is about the same. It is only in Bongo where the corresponding figure is 79.6 per cent of those aged 12-14 years. Ever married The traditional practice of early and almost universal marriage, especially for women is reflected in the fact that in the region and in each district, about three out of every four persons aged 15 years or older have been married before. More females than males have been married before (82.8 % females compared to 66.6 % males). The lower proportion of males who have ever married also reflects the fact that men are more likely than women to postpone marriage since traditional practices expect the man to initiate the marriage by paying the bride price and the responsibility for family maintenance. Both of these require careful and thorough preparation. The region’s total ever married is higher than what is observed for the country as a whole where only two out of every three (68.1%) have ever married. The proportions of males (61%) and females (74.9%) ever married are also lower in the country compared to the region. Bawku West has the highest proportion of ever-married persons (81.5%) followed by Bongo (79.5%), with the lowest (71.9%) in Bolgatanga. In each district, the proportion of evermarried females is higher than that for males. Never married The eligible population (aged 15 years or older) who are never married ranges from 18.5 per cent in Bawku West to 28.1 per cent in Bolgatanga, the regional capital. The proportion of eligible males who are never married ranges from 25.5 per cent in Bongo to as highas 36.0 per cent in Bolgatanga. The proportion of eligible females who are never married ranges from 21 per cent in Bolgatanga to 13.7 per cent in Builsa. Currently married A high proportion of the population in the districts aged 15 years or older had married. About 62 per cent of the population in the region are currently married, consisting of 58.5 per cent male and 64.5 per cent females. The proportion currently married is higher in the region than in the country as a whole where only 49.9 per cent are currently married. The proportion males (58.5%) and females (64.5%) currently married are also higher than the national average of 48.1 per cent males and 51.6 per cent females. In the districts, the highest proportion of currently married is 67.5 per cent in Bawku West and the lowest is 57 per cent Bongo. Among the male population, the proportion ranges from 55.7 per cent in Kassena-Nankana to 64 per cent in Bawku West, while for the female population, the proportion currently married ranges from 57.2 per cent in Bongo to 70 per cent in Bawku West. Consensual union or “living together” is not a common practice in the region. Less than two per cent are reported as being in such a union. This is far lower than the national figure of 6.7 percent. No longer married In the region as a whole, separation, just like “living together” is not a common practice. Less than two per cent of the population aged 15 years or older are reported as separated (1.6 %). Slightly more females (1.7%) than males (1.4%) are reported as separated. The observed proportion of the population separated in the region is about the same as the total country figure of 1.8 percent. In the districts, spouses who are separated range from one per cent in Bawku East to 3.4 per cent in Bongo. The proportion of females reported as separated is slightly higher than that of males in each district, except Bongo. Only 2.2 per cent of the population aged 15 years or older is reported to be divorced in the region, ranging from 1.6 per cent in Bolgatanga and Bawku East to 4.8 per cent in Bongo. In the light of the fact that the region has the highest proportion of ever-married population in the country, the rather low levels of separation and divorce in the region are an indication of stable relationships. Less than a tenth of the population of the region (8.5%) are widowed, consisting of 3 per cent males and 13 per cent females. These proportions are about twice those of the country: 5 per cent (2.1% males and 7.8% females). At the district level, the widowed proportion ranges from 6.8 per cent in Bawku East to 10.9 per cent in Bongo. The substantial imbalance between the proportion of males and females widowed may be explained by the higher survival rates of women in the country, and by the practice of polygamy. In a polygamous family, one man’s death results in more than one woman becoming a widow, whereas one wife’s death in the same polygamous family does not result in a man reporting himself as widowed. Another likely explanation of the substantial imbalance is that men are more likely than women to remarry after the death of a spouse. Since older men tend to marry younger women, and women survive longer than men on average, husbands are more likely to die earlier leaving more widowed women. There is the need for programmes that will be directed to all aspects of reinforcing the support system to take care of the need of widows. In this regard, NGOs working in the interest of widows in the three northern regions should be supported Nationality and ethnicity Ghanaians by birth or parenthood constitute 92.5 per cent of the population of the region. Naturalized Ghanaians constitute 5.3 per cent and the rest are non-Ghanaians. There are far fewer non-Ghanaians (2.1 percent) than naturalised Ghanaians. Ethnicity of Ghanaians The main ethnic groups in the region are the Mole-Dagbon, Grusi, Mande-Busanga and Gurma. Among the Mole-Dagbon, the Nabdam, Kusasi, Nankani/Gurense and Builsa are significant. The significant other subgroups are the Kassena among the Grusi, the Busanga among the Mande-Busanga and the Bimoba among the Gurma. The regional picture however changes, depending on the base district of the ethnic groups. The Nabdam who form 30.5 per cent of the region’s population, make up 94.2 per cent of the population of Bongo and 83.8 per cent of the population of Bolgatanga. The Builsa, who constitute 7.6 per cent of the region’s population, make up 84.1 per cent of the population of Builsa. The Kassena and the Nankani, who make up 15.7 per cent of the region’s population, together make up 88.3 per cent of the population of Kassena-Nankana. The Kusasis make up 22.6 per cent of the region’s total population, but they make up about 75 per cent of the population of Bawku West and 47.6 per cent of the population of Bawku East. The Busanga also make up about 6 per cent of the region’s population and are mostly in Bawku East (15.4%) and Bawku West (7.8%). The Mamprusi comprise only 1.8 per cent of the region’s population. They are thinly spread in the districts. The highest concentration is in the Bawku East district where they comprise 3.7 per cent of the population. However, the two adjacent districts in the Northern region, which are located to the South of Bawku East and Bawku West, are mostly Mamprusi. Bawku East is the most mixed district in terms of ethnic groups. Only the Kusasi and the Busanga constitute more than ten per cent of the population. The two ethnic groups account for 63 per cent of the population. The remaining 37 per cent is made up of over thirty other ethnic groups, including the Bimoba and the Mamprusi. The socio-cultural problems that can arise as a result of the ethnic diversity of Bawku East often manifested in the many ethnic conflicts in the district. Religious affiliation Three main religious groupings are found in the region, namely the Traditional (46.4%), Christianity (28.3%) and Islam (22.6%). Builsa has the highest proportion of Traditionalists (63.7%) followed by Bawku West (61.9%). The lowest proportion (26.8%) is in Bawku East where Islam (51.1%) is the predominate religion. The second major religion is Christianity, constituting of 28.3 percent; it is not predominant in any district. Within the Christian religion, the Catholics are in the majority. This is explained in terms of the work of the Order of the White Fathers who arrived in Navrongo in 1906 and began proselytizing the northern territories. Following the Catholics (57.7%) are the Pentecostal/Charismatic groups (21.7%) and Protestants (12.3%). The regional picture is replicated in all the districts (irrespective of the size of the Christian population) except Bawku West where the Pentecostal/Charismatic group constitutes the majority of Christian population. Educational Attainment and literacy The high correlation between levels of education and positive health and other social indicators makes education a very important variable in any development planning at the district level. Higher education, especially of women, is usually associated with greater knowledge and use of sound health practices and family planning methods. Successive governments introduced various policies aimed at reducing illiteracy among the population to the barest minimum. The current programme of Free Compulsory Universal Basic Education (fCUBE) is supposed to guarantee free education to all children of school going age. Although the information on school attendance was collected for everybody aged 3 years or older, official school entry age in the country is 6 years. The analysis therefore focuses mainly on the school attendance of persons aged 6 years and older, while the data for the 3-5 years are presented to show the extent of pre-schooling, which has become official policy, but is not fully enforced. Of the total of 19,469 children aged 3-5 years in the region who are in school, 77.2 per cent are in pre-school and 22.8 per cent are in primary school. While the start-up for primary school is age 6, a few pupils start at age 5. The proportion of boys (76.5%) and girls (77.9%) who are in pre-school is about the same. For the country as a whole, the proportion of the population that has ever attended school is 60.4 per cent (66.2% of males and 54.8% of females). The gap in the educational attainment between the country and the region is still very wide. The lack of education in the region is not due only to general poverty and cultural practices but also to the very late introduction of education into the region. A comparison of the data on school attendance shows that there has been some improvement in the region. In 1984, 82.3 per cent of the population aged 6 years or older had never attended school and this proportion dropped to 69.4 per cent in 2000. Among the males, the proportion that had never attended school was 75.6 per cent in 1984, but reduced to 64.0 per cent in 2000. Although the proportion of females who had never attended school is still higher than that for males, the proportion has reduced from 88.1 per cent in 1984 to 74.4 per cent in 2000. School attendance At the district level, Bawku East has the highest proportion (77.3%) of the 6 years and older who have never attended school (91.3% males and 82.7% females). This situation is most likely due to the combined effects of the late introduction of Western education, the influence of Islamic religion, general poverty and other cultural practices. The lowest proportion (61.2%) is in Bolgatanga (55.9% males and 66.2% females). The problem with education is the large number of persons aged 6 years and older who have never attended school. The data shows that in the region, more females than males have never attended school. When the population who have ever attended school is isolated, the levels attained are not significantly different between males and females. Primary school is the highest level attained by 52.4 per cent in the region. Three-quarters (74.5%) of those who have attended school in the region reached only primary or middle/JSS levels. The proportion of males who have attended school in the region who reached primary school level is 18.0 percent, compared to 14.3 per cent for females. About 8.1 per cent males and 5.5 per cent females attainted middle/JSS level. Thus put together the proportion of females in the region (19.8%) with primary and middle/JSS is lower than that for males (26.1%). A higher proportion (9.4%) of males attain higher levels of schooling than females (5.3%). Only 3.5 per cent who have ever attended school reached secondary/SSS level. This is made up of 4.5 per cent males and 2.6 per cent females. The proportion with the vocational/technical/commercial level is 1.3 percent, made up of 1.7 per cent males and 1.0 per cent females. Those with post-secondary level (agricultural schools, nursing training schools and teacher training colleges) make up 2.5 percent, with 3.2 per cent being males and 1.7 per cent females. About 1.0 per cent attained the tertiary level, made up of 1.4 per cent males and 0.8 per cent females. A comparison with the national situation also shows that there is significant difference between the proportions of males and females who have never attended school. Although the differences between the region and the total country for various educational levels, the differences are very large. For example 45.8 per cent at the national level attained up to middle/JSS, while at the regional level it is 22.7 percent. The data shows that within each district, three out of every four persons (74.5%) who had ever attended school attained primary or middle/JSS level. The proportion ranges from 72.2 per cent in Bolgatanga to 81.1 per cent in Bawku West. Within the districts at least 10 per cent attained JSS/SSS level except Bongo (9.7%) and Bawku West (8.6%). The proportion that attained Vocational/Technical/Commercial education level ranges from 2.9 per cent in Bawku West to 5.2 per cent in Bolgatanga. The proportion that attained Secondary/Teacher Training level varies from 3.0 per cent in Bawku West to 5.2 per cent in Kassena-Nankana. Only 3.5 per cent of those who had ever attended school reached the tertiary level varying from 2.3 per cent in Builsa to 4.0 per cent in Bongo. The much-discussed educational difference between males and females in the region is due, as much to differences in initial enrolment, as to differences in school achievement. Since fewer females than males have attended school there is bound to be fewer females at each level of education, even assuming the ideal situation of females achieving the same school continuation rates as males. Data on current enrolment show that the gap between boys and girls in school attendance still exists. In each district and at almost every level, more boys than girls are enrolled; Builsa is the exception, where the majority of pupils are girls. Generally, at every level the proportion of girls progressing to the next grade reduces from one grade to the other. Literacy The 2000 Census results show that only 23.5 per cent of the region’s population (15 years and older) are literate in either English or a known Ghanaian language (7.0% are literate in both). For the region as a whole and for each district, illiteracy is higher for females than for males. The overall level of literacy is about 80 per cent or higher in three districts, Builsa (79.8%), Bawku East (81.2%) and Bawku East (87.0%). For females, the level is below 80 per cent in Kassena-Nankana (78.6%), Bolgatanga (76.3%) and Bongo (74.9%). Much of literature and mass communication is in English. This means that the level of effective literacy (literate in English only or literate in English and a Ghanaian language) is only 21.4 per cent in the region. Among the districts, Bolgatanga (27.7%) has the highest effective literacy level with 34.2 per cent for males and 22.0 for females. The lowest effective communication level (12.0%) is in Bawku West with 17.4 per cent for males and 8.2 per cent for females. Three districts (Builsa (17.3%), Bawku West (12.0%) and Bawku East (16.5%)) all have literacy below 20 percent. These are the same three districts with very low levels of school attendance. In view of the fact that current publications effectively exclude the proportion literate in Ghanaian language only, greater efforts need to be made to translate very useful reading communication materials as well as publish newspapers in Ghanaian languages. Literacy in a Ghanaian language is low in the region. The proportion literate in a Ghanaian language (Ghanaian language only and English and Ghanaian language) is 8.3 per cent compared to the proportion literate in English only (14.4%). At the national level, the proportion literate in a Ghanaian language/English and a Ghanaian language is 40.6 per cent compared to 16.4 per cent literate in English only. In the districts, the proportion literate in a Ghanaian language ranges from 0.5 per cent of the population aged 15 years and older in Bawku West to 2.6 per cent in Bongo. The low level of literacy in a Ghanaian language in the region may imply that the teaching of Ghanaian languages in schools in the region is not being pursued in a sustainable manner. The differences in the proportion which are in the “effective functional literacy” category and the proportions literate in a Ghanaian language may also imply that literacy is acquired mostly in the classroom setting than through the existing adult education or functional literacy programmes. ECONOMIC CHARACTERISTICS Type of activity 67.6 per cent of economically active persons had worked for at least one day during the reference period. The proportion for males (66.1%) is lower than that for females (69.1%). About one in eight (12.3%) had jobs but did not work. The unemployed constitute 20.1 percent, which is almost twice the national figure of 10.4 percent. The proportions employed are higher than 65.0 per cent in all districts except Bawku West (60.6%). The proportion unemployed (20.1%) is higher than that of those who had job but did not work (12.2%). In each district, slightly more females than males worked. The proportion for males ranges from 58.4 per cent in Bawku West to 69.7 per cent in Builsa while that for females ranges from 62.6 per cent in Bawku West to 75.3 per cent in Builsa. Unemployment is slightly higher for males than for females in each district. The overall level of unemployment is highest in Bongo (26.0%) and Bawku West (27.4%). The not economically active (aged 15 years and older) In the region and in each district, females constitute the higher proportion of the not economically active population because of the greater proportion of females who are homemakers. Persons who are not economically active are mainly homemakers (38.3%) and students (19.4%). Among these, males (31.0%) are about two and a half times more likely than females (12.4%) to be students, while females (40.2%) are twice more likely than males (22.0%) to be homemakers. About a fifth (16.6%) of the not economically active attribute their status to old age, while about 3 per cent each attribute it to a disability or the fact that they are on retirement/pension. The regional pattern is repeated in each district. The proportion of the not economically active that is students ranges from 13.0 per cent in Bawku West to 22.5 per cent in Bolgatanga. Almost one in five are not working because of old age. The old age category ranges from 13.4 per cent in Bolgatanga to 21.4 per cent in Bawku West. In each district, there are slightly more females than males who are not working because of old age. The retired/pensioner group ranges from 1.9 per cent in Bawku East to 3.9 per cent in Builsa. In the districts, the proportion not working because of some disability ranges from 2.4 per cent in Bolgatanga to 6.6 per cent in Bongo. Age structure of the economically active population (aged 15 years and older) The data show that, in each district, there is a large pool of human resources available to work. The economically active are young and thus available to work for several years. In every district, the 15-29 years age group, who are energetic and in the prime of their youth, constitute at least 30 per cent of the economically active population. The proportions in this category range from 33.1 per cent in Bongo to 41.5 per cent in Bolgatanga. The proportion aged 15-29 is highest in Bolgatanga (41.5%), Kassena-Nankana (39.8%) and Builsa (38.1%), while Bongo has the lowest proportion (33.1%). The population aged 30-44 years who are likely to have considerable work experience constitute between 26.2 and 27.9 per cent of the economically active population in the districts. The proportion of the economically active population aged 45-59 years ranges from 16.2 per cent in Bawku East to 22 per cent in Bongo, while that for the elderly (60 years or older) ranges from 13.4 per cent in Bolgatanga to 18.2 per cent in Bawku West. In this predominantly peasant labour intensive agricultural economy, if the district economies do not grow rapidly and jobs are not created sufficiently to match the economically active population, there will be a constant pool of unemployed labour. The already existing large proportion of the unemployed poses a challenge for job creation. Occupation The major occupations in the region are agriculture and related workers (66.4%), production and transport equipment workers (14.7%), sales workers, (9.6%), service workers (4.0%) and professional, technical and related workers (3.8%). The first three together make up 90.7 per cent of occupations at the regional level. In four of the districts these three contribute to more than 90 per cent of the economically active population. In all the districts, agriculture and related workers are the single largest occupation. Production and transport equipment workers constitute a substantial second in all districts except Bawku East, where sales workers are the second major occupation. Sales workers are otherwise the third major occupation in the other districts. Professional, technical and related workers are about the same proportion as service workers in many districts. The substantial lack of formal sector office-based bureaucratic activities in the region and in the districts is reflected in the fact that the proportion administrative/ managerial and clerical related workers in the region make up only 1.7 per cent of the active population. The relative order of importance of the various occupations (in terms of employment) is maintained for both males and females and in each district, except that there are proportionately more males in agriculture, professional and related work and in managerial/administrative and clerical work. Females, on the other hand, are predominantly as sales workers, service workers and production and transport equipment workers. Industry The three major industrial activities at the national level are agriculture, including hunting, forestry and related work (49.1%), wholesale and retail trade (15.2%) and manufacturing (10.9%). The three account for a total of 75.2 per cent of the industrial activities of the economically active population (aged 15 years or older). These are also the three major industrial activities at the regional level except that the order is changed: agriculture, including hunting, forestry and related work (67.2%), manufacturing (11.3%) and wholesale and retail trade (9.6%), and they contribute a much higher proportion (88.1%) of industrial activities. Significantly, these three remain the major industrial activities in each district, with agriculture as the primary activity in all districts and for both males and females. The relative importance of manufacturing and trade varies between districts. Agriculture is the major industry in all districts, ranging from 51.6 per cent in Bolgatanga to 85.0 per cent in Bawku West. The proportion of males (72.6%) engaged in this activity is higher than that of females (62.1%) and this is true for all districts. For males the proportion ranges from 57.7 per cent in Bolgatanga to 89.0 per cent in Bawku West, while that for females is from 44.8 per cent to 81.5 per cent in the same districts. Manufacturing, the second major industry, is lowest in Bawku West (4.0%) and highest in Bongo (26.4%). The positions of these districts relative to the others remain the same with both males and females. Unlike in agriculture, the proportion of females engaged in manufacturing is higher than that of males at the regional and district levels (often about twice). The proportion ranges between 1.9 per cent in Bawku West and 18.0 per cent in Bongo for males and between 6.0 per cent in Bawku West and 32.9 per cent in Bongo for females. The high proportions of the economically active populations of Bongo and Bolgatanga for both males and females may reflect the fact that these two districts produce the bulk of the well-known raffia baskets (“Bolga basket”) and leather products. The proportion engaged in wholesale and retail trade, the third major industrial activity in the region and in 3 of the districts, is lowest in Bawku West (4.9%) and higher in Bawku East (11.6%), followed by Bolgatanga (10.8%). The proportion remains the lowest in Bawku West for both males (2.5%) and females (7%) and highest in Bawku East (8.4% males and 14.4% females) and Bolgatanga (7.4% males and 14.5% females). All the remaining thirteen industry groups (“all others”) make up 12 per cent of industrial activities in the region. The combined proportion of these industrial activities is significant only in Kassena-Nankana (13.1%) and Bolgatanga (19.8%). Employment status Another important characteristic of the economically active population is employment status. In the country as a whole, 74.4 per cent of economically active persons are self-employed without employees with an additional 5 per cent with employees. Formal sector employees constitute 15.3 percent. About a tenth of economically active persons are either unpaid family workers (6.6%) or apprentices (3.7). Three quarters (74.4%) of the economically active population at the regional level are self-employed without employees. The proportion ranges from 68.6 per cent in Kassena- Nankana to 87.6 per cent in Bongo followed by 83.5 per cent in Builsa. Unpaid family workers form the next highest group (14.0%) and ranges from 6.4 per cent in Bongo to 18.3 per cent in Bawku East, followed by 18.2 per cent in Kassena-Nankana and 17.2 per cent in Bawku West. Employees and the self-employed with employees (who could be taxed at source) make up less than a tenth in every district except the Kassena-Nankana (10.5%) and Bolgatanga (13.8%). Such an employment structure poses a challenge for the effective mobilization of tax revenue as well as mobilization of capital for expansion and job creation. The implications for any policy on taxation and economic development would need to be considered carefully. Males and females show a similar pattern of employment status except for the employee category where, in every district, there are approximately two males to each female employee. In the Bolgatanga district, there are approximately two females to each male domestic employee. Institutional sector The private formal sector employs about a fifth (21.2%) of economically active population in the region. The proportion ranges from 18.0 per cent in Builsa to 27.5 per cent in Bawku West. The public and semi public sector employs an additional 4.2 percent. Public sector employees make up between 2.5 per cent in Bawku West and 7.0 per cent in Bolgatanga. This means that the formal sector constitutes only 25.4 per cent of the economy of the region and this has implications for tax revenue mobilization. Distribution of institutional sector by sex shows that the private informal sector remains the largest employer of the working population for both males and females in every district. In each district, there are slightly more females than males in this sector. On the other hand, in each district, there are twice as many males as females in the public and semipublic/ parastatal sectors. In the other formal sectors, (private formal, NGO/International Organization, and others) males and females are represented in approximately the same proportions in each district. Working children The phenomenon of working children (i.e. engagement in economic activity by children of school going age 7-14 years) is widespread in all districts. The distribution of children by occupation, industry, and employment status and institutional sector generally follows closely the pattern of the adult population in each district. The significant differences are that none of the children is engaged in formal sector occupations such as professional and technical work, administration managerial or clerical work. In relation to industry, there are more children in the private household industry than is recorded for the adult population. None of the children work in the public sector, private formal sector, semi public/parastatal sector and NGO/international organizations. All the children are employed in either the private informal sector (80%) or in the category “other sector”. More than four fifths (86.9%) of the children in Builsa are agriculture and related workers. About a tenth (7.3%) are service workers and 2.7 per cent are sales workers, with 2.3 per cent in production and transport equipment work. In relation to industry, 87.6 per cent of the children are involved in agriculture including hunting, forestry and fishing, while 7.1 per cent are in the private household industry, 2.7 per cent are in wholesale and retail trade and 2 per cent in manufacturing. Most of the working children in the district are either self-employed without employees (74.4%) or unpaid family workers (21.1%). Domestic employees account for 2.7 per cent of working children. Kassena-Nankana Nearly three-quarters (71.8%) of the working children in Kassena-Nankana are agriculture and related workers, 18.1 per cent service workers, 5.1 per cent production and transport equipment workers and 4.1 per cent sales workers The most important industrial activity of the children is agricultural and related activities, including hunting forestry and fishing (72.8%), followed by private household (13.9%), wholesale and retail trade (4.5%) and manufacturing (3.8%). In terms of employment status, 52.8 per cent are own account workers, 35.1 per cent are unpaid family workers and an additional 5.6 per cent are domestic employees. Two per cent are employees, and one per cent is an apprentice. Seven out of ten (71.0%) are in the private informal sector. The remaining categories are in the “others” category. Bongo Three-fifths (60.3%) of the children are agricultural and related workers. Nearly a third (29.7%) are production and transport equipment workers, while about a tenth are services workers (5.0%) and sales workers (4.6%). The major industrial activities engaged in by the children are: agricultural related activity, including hunting, forestry and fishing (62.4%), manufacturing (25.2%) and wholesale and retail trade (4.8%). A few of the children are engaged in mining and quarrying activities (1.5%) in the private household activities (1.7%). In relation to employment status, most of the children are self-employed without employees (83.3%), unpaid family workers (10.2%) and domestic employees (3.1%). Employees (1.2%) and apprentices (1.1%) are not significant groups among working children. The working children in the district are all in the informal sector (73.0% private informal and 27.0% other); there are no working children in the formal sector. Bolgatanga The three main occupations among working children in Bolgatanga are agriculture and related occupations (61.5%), production and transport equipment work (23.1%) and service work (10.3%); about 4.5 per cent are sales workers. The five major industrial activities, accounting for 96.5 per cent of all industrial activities, are agricultural activity including fishing (62.6%), manufacturing (17.7%), private household (7.1%), hotels and restaurants (5.5%) and mining and quarrying (3.5%). In terms of employment status, 60.2 per cent are self-employed without employees, 28.2 per cent are unpaid family workers and 4.7 per cent are domestic employees. Very few are apprentices (2.0%) or employees (2.5%). Three out of four working children (74%) are employed in the private informal sector. Bawku West In Bawku West, the major occupations of working children include agriculture and related workers (92.5%), services workers (3.3%), and sales workers (2%), and production, and transport equipment workers (1.9%). The main industrial activities are agriculture including hunting, forestry and fishing (92.8%), wholesale and retail trade (2.1%), private household (2.2%) and wholesale and retail trade (2.1%). Most working children in the district are mainly self-employed without employees (61.4%), unpaid family workers (35.1%) and domestic employees (1.6%). Employees and apprentices make up 0.9 per cent each. About two-thirds (68%) of the children work in the private informal sector. Bawku East The major occupations of working children in Bawku East are agriculture and related workers (85%), service workers (5.9%), sales workers (5.3%) and production and transport equipment workers (3.1%). The predominant industrial activities for working children in the district are agricultural activities including hunting, and forestry and fishing (85.5%), wholesale and retail trade (5.8%), private household (4.0%) and manufacturing (1.8%). The working children in the district are mainly self-employed without employees (61.7%), unpaid family workers (33%), domestic employees (1.9%), employees (1.6%) and apprentices (1.1%). Three out of four (74.0%) working children are in the private informal sector. |
|
As already shown, a large majority of households in the region live in dwelling units owned by members of the household (86.7%). This proportion is higher than what pertains at the national level where 57.4 per cent of households own the dwelling unit and 22.1 per cent pay rent. About a tenth (9.5%) of the households in the region pay rent and 3.4 per cent live in rent-free accommodation. The proportion of households owning the dwelling unit ranges from 79.9 per cent in Bolgatanga to 93.1 per cent in Bawku West.
Less than five per cent of households in the region live in rent-free accommodation, compared to 19.5 per cent in the country as a whole. The proportion of households enjoying rent-free accommodation ranges from 1.9 per cent in Bongo to 4.8 per cent in Bolgatanga. The proportion of households paying rent ranges from 4.5 per cent in Bawku West to 14.9 per cent in Bolgatanga.
Construction materials
Material of outer walls
Mud/mud brick/earth (88.2%) and cement or concrete (8.4%) are the two main materials for the construction of the outer wall. The two materials account for over 95 per cent of materials used in each of the districts. The highest proportion of mud/earth use is in Bongo (97.3%) while the lowest is in Bolgatanga (81.6%). On the other hand, cement/concrete for outer wall construction is highest in Bolgatanga (14.6%) and lowest in Bongo (1.6%) and Bawku West (1.6%).
The use of mud/mud brick/earth as main material of outer wall reflects the adaptation of the population to the hot environment, and it also the result of availability and cost of these local materials.
Material of floor
In the region, the same two main materials used for the construction of outer walls (i.e. mud, mud bricks/earth, and cement/concrete) account for 95.8 per cent of materials for the floor of dwelling units as well. The proportional share of the two materials ranges from 92.6 per cent in Kassena-Nankana to 97.4 per cent in Bawku West. The use of earth/mud is highest in Bawku West (88%) and lowest in Bawku East (41.7%), while the use of cement/concrete, is highest in Bawku East (54.4%) and lowest in Bawku West (9.4%). Source: 2000 Population and Housing Census. Ghana Statistical Service.
In Bolgatanga, the use of mud/earth is in almost equal proportions (with a slight advantage in favour of cement). In general, cement/concrete is more common in the more urbanized districts (Bolgatanga and Bawku East), while earth/mud is more common in the more rural districts (Builsa, Bongo and Bawku West).
Material of roof
Thatch made from grass (43.1%), corrugated metal (18.2%) and mud/mud bricks (31.3%) are the three main roofing materials in the region. The differences between the districts in the use of roofing materials. For example, whereas only 8.9 per cent of households in Kassena-Nankana live in houses roofed with thatch from grass, 78.2 per cent in Bawku West live in houses roofed with thatch from grass. Mud/mud brick is used mostly in Builsa (46.9%) and Kassena-Nankana (54.2%).
The architectural mud roofing phenomenon of flat mud roof houses is prevalent in northern Ghana and serves as sleeping place for households when normal sleeping rooms become unbearably hot. Corrugated metal is used for roofs mostly in the three most populous and most urbanized districts of Bolgatanga (42.8%), Bawku, (39.9%) and Kassena-Nankana (23.5%).
Household facilities and amenities
Room occupancy
The total number of rooms occupied by the household includes sleeping rooms. Information on the number of sleeping rooms occupied by the household provides an indication of the level of overcrowding and adequacy of dwelling stock available. It also reflects the socioeconomic condition of the household. There are more rooms available to each household in the region than in the country as whole. For the country, 61.8 per cent of households occupy only one or two rooms, compared to 24.4 per cent in the region. There are also more households occupying seven or more rooms in the region (21%) than in the country (8.6%) as a whole.
The proportion of households with one or two rooms varies between 9.3 per cent in Bawku East to 37.4 per cent in Kassena-Nankana. The proportion of households occupying three or four rooms is highest (45.2%) in Builsa and Bongo (44.1%) and lowest (20.4%) in Bawku East. The proportion of households occupying five or six rooms ranges from 13.7 per cent in Kassena-Nankana to 26.6 per cent in Bawku West. Bawku East, with high concentration of population has the highest proportion of households occupying seven or more rooms (46.1%), followed by Bawku West (29.8%).
Number of sleeping rooms
In the country as a whole, 71.4 per cent of households use one or two sleeping rooms, compared to 61.8 per cent that have one or two rooms. In the region also, about two-fifths (38.8%) of households have one or two sleeping rooms compared to 24.4 per cent with a total of one or two rooms. This is because not all rooms available to the household are used for sleeping purposes.
In Builsa (48.8%), Kassena-Nankana (53.1%) and Bolgatanga (47.9%), about half of households use only one or two sleeping rooms. The lowest proportion is in Bawku East (19.1%). The proportion of households that has three or four sleeping rooms is 36.5 per cent in the region as a whole. The proportion is higher than the regional figure in Bongo (42.7%), Bawku West (41.5%) and Builsa (40.6%) and closer to the regional in Kassena-Nankana (35.3%), Bolgatanga (35.2%) and Bawku East (34%).
The proportion of households using five to six sleeping rooms ranges from 7.6 per cent in Builsa to 23.2 per cent in Bawku East. Bawku East also has the largest proportion of households with seven or more sleeping rooms (23.8 percent). This proportion is twice as large as the regional proportion of 10.5 percent. The proportion of households with seven or more sleeping rooms is 13.8 per cent in Bawku West while it is far below the regional figure in the remaining four districts.
Households size and number of sleeping rooms
The total number of sleeping rooms used by households and the total number of household members can be used to measure the extent of over crowding. Over-crowding can however be seen also from the angle of the age and sex distribution of household members and thus the amount of privacy adult household members can enjoy. For example, a single parent sharing one sleeping room with his/her teenage child can be said to be crowding each other because of the lack of privacy whereas a couple with a two-year old child, occupying one sleeping room could be perceived as normal and therefore not overcrowded.
In the absence of detailed characteristics of room occupants, the total number of sleeping rooms is used in this report to analyse over-crowding. Given that in the region, the average household of six persons is a mix of parents (head of household with or without spouse, children and other relatives of different ages and very likely of both sexes), the ideal situation would be an average of two sleeping rooms for the six members.
On the basis of this “ideal” situation, it would be appropriate to state that one to three person households would be expected to have at least one sleeping room, 4-6 households, at least two sleeping rooms, 7-9 person households at least three sleeping rooms and ten or more person households, at least four sleeping rooms. It is worth noting also that in the region, between 46 and 58 per cent of households with ten or more persons have six or more sleeping rooms. For example, of the households using nine or more sleeping rooms in Bawku West, 58.8 per cent have nine or more members. Similarly, in Bawku East, among households with nine or more rooms, 56.8 per cent have ten or more members.
In the region as a whole, 42 per cent of households with one sleeping room can be classified as over crowded because they have four or more members, 20.3 per cent of households occupying two rooms are over-crowded and 9.3 per cent of households occupying three sleeping rooms are over-crowded. About three quarters (72.6%) of all households using five or more sleeping rooms have seven or more members. Over-crowding is lower in Builsa compared to the region as a whole. About 36 per cent of households with only one sleeping room are over-crowded compared to 42 per cent in the region. Among the households with two sleeping rooms, about one in eight (12.6%) can be classified as over-crowded and only 3.4 per cent of households occupying three sleeping rooms are considered as over-crowded compared to the regional proportion of about 9 percent.
Twice as many 1-3 person households in the districts (16.4%) have five or more sleeping rooms compared to 7.5 per cent in the region as a whole. A little over a half (52.6%) of households using five or more sleeping rooms have seven or more members. The extent of over-crowding in Kassena-Nankana is similar to that of the region as a whole. About 44 per cent of all households occupying one sleeping room can be classified as overcrowded.
Among all households with two sleeping rooms, about a fifth (21.6%) is overcrowded. Less than a tenth (9.3%) of households occupying four sleeping rooms can be classified as over-crowded. Two-thirds (64.0%) of households occupying five or more sleeping rooms in the district, however, have seven or more members, compared with 72.6 per cent in the region as a whole. The overall regional pattern is again repeated in Bongo. About two-fifths (43.2%) of households occupying one sleeping rooms are over-crowded and 18.4 per cent of all households with two sleeping rooms are over-crowded. In all the other districts, the pattern is similar to what is observed in the region as a whole.
Determination of the population in occupied households, in comparison with the total number of households, as well as the population per room can give an indication of the prevalence of “homelessness” and the extent of over-crowding in a locality. Ideally, more than two persons should not occupy a room, and any room occupancy ratio above 2 persons per room is considered to be on the threshold of over-crowding. All the districts in Upper East have room occupancy below the threshold value. The regional average is 1.8 persons per room, which is well below the national average of 2.3 persons per room. Three districts, Builsa, Bawku East and Bawku West have occupancy ratios of 1.7 persons per room, while Kassena-Nankana has the highest ratio of 2.0. Many households are able to construct their own inexpensive but adequately roomed dwelling places, which is why overcrowding does not as yet appear to be a major problem in a relatively less developed region as the Upper East.
Notwithstanding the high populations per house and population per household in the region, therefore, there are enough rooms for each member of the household to avoid overcrowding. This is a very important factor for a region which falls within the cerebro-spinal-meningitis endemic belt of the country; a disease whose aetiology and epidemiology depend very much on overcrowding and poor ventilation in places of population concentration. Overcrowding carries with it health risks and social implications, and District Assemblies should do everything possible to maintain a housing policy that will maintain the current adequate sleeping space and even improve upon it.
There are 2,394 persons in the region who were enumerated outside the home, constituting 3.9 per cent of the national figure as compared to Ashanti Region (19.1%) and Greater Accra Region (27.0%). This number includes persons who were in prison/hospital or in transit on Census night or persons on the street. The actual number of homeless households is 24 which indicates that homelessness is not a major problem in Upper East. The homeless households constitute 1.0 per cent of the national figure and 0.02 per cent of all households in the region.
Main source of lighting
Nationwide, 43.7 per cent of households use electricity as the main source of lighting while the kerosene lamp remains the major source of lighting for 54.9 per cent of households. In the region, however, 84.6 per cent use the kerosene lamp. Over 90 per cent of households in Builsa (92.7%), Bongo (90.7%) and Bawku West (91%) use the kerosene lamp. Even in Bolgatanga, with the highest proportion (19.5%) of households using electricity, 78.1 per cent use kerosene for lighting. The availability, accessibility and affordability of kerosene should therefore be of great concern in each district of the region. The other sources of lighting are insignificant. Communities with no light whatsoever range from 1 per cent in Builsa to 3.5 per cent in Bongo.
Bolgatanga has the largest proportion of households using electricity (19.5%), followed by Bawku East (15.2%). Less than ten per cent of households in each of the other districts use electricity. The programme of rural electrification needs to be intensified since the availability of electricity is not meant only for household lighting, cooking and food preservation but also promotes industrial and other economic activities.
Main source of cooking fuel
Firewood is the most used cooking fuel in the region (66.5%). Millet stock or corn stock is used by 18 per cent of households in the region, and charcoal is used by 11.6 percent. These are also the three main sources of cooking fuel in each of the districts. In all the districts, except Bongo, wood is the main source of cooking fuel. In Builsa, 90.3 per cent of households use wood for cooking. In Bongo, where wood is used by only 25 per cent of the population, most households (70%) use sorghum/millet stock. Significantly, charcoal use in the region is relatively low, from 2 per cent in Bongo to 20.3 per cent in Bolgatanga. It is higher than 10 per cent in only the 3 more urbanised districts of Kasesena- Nankana (10.1%), Bolgatanga (20.3%) and Bawku East (11.7%).
Each of the main sources of fuel used for cooking has associated problems. The use of firewood is cumbersome, affects the health of women and children, and leads to the depletion of the forests. The use of charcoal, in the long run, is expensive and also results in reductions in the forest cover of the charcoal producing areas. Thus, the uses of charcoal and firewood have serious implications for the environment. Gas and electricity are not very affordable and accessible to most households.
In all, 85.9 per cent of the households in the country and 78.1 per cent in the region use cooking fuels that deplete the forest cover (wood and charcoal). The environmental implications should therefore be a national concern. Attempts should be made to intensify agro-forestry, including cultivation of drought-resistant trees and fuel wood such as acacia, neem and shea-nut trees.
Cooking space
Almost all households in the region (97.5 percent) have some cooking space within the premises of the housing unit. About seven out of ten (70.5%) households have structures specifically set aside for the purpose. A further 26.6 per cent use the open compound space or veranda in front of their living quarters or in their rooms. The regional picture is replicated in the districts.
The highest proportion of households that use a separate kitchen is in Builsa (64.8%), and lowest in Bongo (9.1%). The use of shared cooking space is not very common in the region.
Three out of every four (77.2%) households in Bongo use “enclosure without roof” as a kitchen. Almost one in five (18.8%) of households in the region cook in the open space within the dwelling unit. The proportion is highest in Bawku East (33.3%), followed by Kassena-Nankana (24.0%) and Bawku West (23.6%), while it is lowest in Bongo (3.3%).
Bathing facility
In terms of bathing space, 82.8 per cent of households in the region use space provided for the purpose within the house, while 15.5 per cent use the open space around the house/compound and 1.3 per cent use either a public bath house or a bathroom in another house. For the districts, Bongo has the highest proportion of households with bathing facility within the house/compound (88.8%) and Kassena-Nankana has the lowest (69%). Households that use public bathhouse or bathroom in another house are few. Bathing in the open space is more common in the three most populous and relatively more urbanized districts.
A higher proportion share bathrooms in the country (separate bathroom shared and open cubicle shared) than in the region. The proportion in this category in the country is 40 percent, while in the region it is 34.5 percent. The proportion of households that use public bathhouse and bathroom in another house is, however, lower in the region (1.2%) than in the country as a whole (6.4%). The use of open space around the house is higher in the region (15.5 percent) than in the country as a whole (8.6%).
Main source of drinking water
The focus of this information is on the main sources of drinking water. “Pipe-borne water inside house” includes water piped into the living quarters or house through an inside plumbing system.
The various water sources are classified by their quality level in relations to their health effects on the consumer. Drinking water is considered safe or potable if it is obtained from pipe-borne supply in or outside the house or is supplied by tanker or is from manual or mechanized boreholes. Even though spring and well water can sometimes be cleaner and clearer than piped water, which can be contaminated at various stages of distribution after treatment, for the purpose of this discussion, potable or safe water will be defined in relation to only treated pipe-borne water and boreholes.
On the basis of this classification, 58.5 per cent of households in the country have access to potable water, made up of 42.1 per cent pipe-borne water or tanker service and 16.4 per cent borehole. In the region, 50.3 per cent of households have access to potable water, (13.7% pipe-borne water or tanker service and 36.6% borehole). 31.6 per cent of households use well water for drinking and the remaining households (18.1%) depend on natural and man-made water sources such as spring, river/stream, rain water and dugout to collect rain water.
The proportion of households with access to potable water, is higher in Bolgatanga (61%) compared to the other districts. The lowest is in Builsa (36.2%), where the well is the main source of drinking water (50.4%). Dependency on all remaining sources of water is above 10 per cent in all the districts, with 13.4 per cent in Builsa as the lowest proportion and 20.0 per cent in Bawku East as the highest.
Waste disposal facilities
Toilet facilities
Both the public and private (in or around the house) toilet facilities can be flush toilets (W.C), pit latrine, KVIP or bucket/pan latrines. Facilities in another house (different house) refer to the situation where the household members use the toilet facility (any type) of another living quarters. Public toilets are for communal or public use (paid or free use). No facility means that there is no toilet facility of any kind available for the use of the household and the household members use places other than the above-mentioned, including the bush, field, rivers or streams. Some people even use “chamber pots” or other small receptacles (including plastic bags) and dispose of these in all sorts of places including open fields, streams and gutters.
The picture with toilet facilities in the region is far from satisfactory. Whereas in the country as a whole 20.2 per cent had no access to any specific facility, 78 per cent of households in the region have no facility. As many as 91.2 per cent of households in Bongo and 84 per cent in Kassena-Nankana have no facility. Even the lowest proportion of households with no toilet facilities is 73.3 per cent (in Bawku East), followed closely by Bolgatanga, the regional capital district, with 75.1 percent.
Thus, even the regional capital district (Bolgatanga) does not show much difference from the total regional picture. Public toilets are not even widely used in the region. Only 6.3 per cent of households use public facilities and most households that use these facilities are concentrated in Bolgatanga (9.2%) and Bawku East (8.6%). Water closet (W.C) in house is not common, given the low level of piped water supply in the districts. Since access to flush toilet is largely influenced by the provision of piped water into the housing facility, it is not surprising that 5.2 per cent of households that have the facility are in Bolgatanga.
In a region where people seem to be very concerned about privacy during bathing (82.8% have use of a space provided within the house), privacy for toilet facilities seems not to be an important issue, even though this has more serious implications. This should be a matter of great concern. The environmental health problems arising out of inadequate disposal of human waste, most often mixed with animal droppings, need urgent attention and redress.
Solid and liquid waster disposal
Solid waste
The information refers to the collection and disposal of solid waste (rubbish) generated by members of the household. Six methods of disposal are specified. The method is categorized as “collected” where the solid waste is either collected by authorized or self-appointed collectors. “Burnt by household” implies that the household burns the rubbish and “Buried by household” is the situation where the rubbish is buried inside or outside the dwelling unit. Disposal at a “Public dump” refers to the situation where the household disposes solid waste at a locally recognized place. When the household disposes solid waste indiscriminately in the bush, along streets, at abandoned or uncompleted building sites or riverbanks, the method is termed “Dumped Elsewhere”. All other methods of disposal are put into the category “Other”.
As with the disposal of human waste, few houses provide for the adequate disposal of solid waste. It should be pointed out that the problem of improper solid waste disposal is a national concern, and not specific to the region. For the country as a whole, only 16.5 per cent of households have a means of burning or burying the waste. For the majority of households (82.6%), the facility is either a public dumpsite or elsewhere at their convenience (Ghana Statistical Service, March 2002), where waste treatment may not be efficient or even exist.
Within the region, only 22.1 per cent of households have a means of burning or burying their solid waste, presumably around the house or having it collected for disposal (3.3%). For the majority of households in the region (68.4%) the facility available is either a public dumpsite (13.2%) or elsewhere at their convenience (55.2%), which could be a stream or open gutter or on someone’s undeveloped plot of land, all of which have serious environmental and health consequences (Ghana Statistical Service, March 2002). Solid waste collected from households varies from only 0.8 per cent in Bawku West to 4.5 per cent in Bolgatanga, while garbage burned by households varies from 4.7 per cent in Bawku West to 26 per cent in Builsa. Solid waste collected from households by qualified garbage collection agencies are perhaps the best way of ensuring that environmental hazards are minimized, because the waste can be properly and scientifically treated. All the other methods carry serious environmental risks.
Under normal circumstances, burning or burying by households would have been efficient, but with the current large volume of plastic waste all over the country, burning releases highly toxic fumes into the atmosphere, while burying does not result in the usual biodegradation into compost, and plastic and other materials can remain in the soil for a long time and even contaminate underground and surface water bodies. In the urban areas, gutters constructed, as storm drains along roads have also become receptacles for solid and liquid waste disposal, thus, becoming sites for mosquitoes and other pests to breed.
Liquid waste
For liquid waste disposal, the picture is not any better. In the country as a whole, only 4.5 per cent of households have an adequate facility (i.e. sewerage system). For the remaining households, the facilities available include a gutter in front of the house (21.1%) on the street/path in front of the house (39%) and the compound of the house (34.6%), (Ghana Statistical Service, 2002).
The situation is not different for the districts in the region. In the region, only 4.1 per cent of households dispose of their liquid waste through the sewerage system. About fifty per cent (52.5%) of households pour their liquid waste on the street or outside; another 35.7 per cent pour the waste in the compound. In all the districts, almost all households dispose of their liquid waste either on the street/outside or in the compound of the house. The proportion of households using these methods of disposal is below 90 per cent in only Bolgatanga and Bawku East.
Community facilities
Data on community facilities
Information on specified community services, such as hospitals and other health facilities, telephone connections, postal services and schools, was collected during the 2000 Census. These are usually strong indicators of the level of development of a community. A variety of factors can influence health services utilization and health outcomes. Among these are the availability of health care services, whether private or public, and the accessibility and quality of such services. Availability of health services may be defined broadly to include a range of conditions: from the availability of the physical health service structure, to the availability of appropriate personnel to run the facilities where available. Travel time and distance to health facilities, are also an important determinant of the use of health care services. Distance and/or the time taken to reach a facility can affect the chances of survival of sick people especially in emergency situations. The Ministry of Health’s accessibility policy goal is to provide health facilities within a travel distance not exceeding 8 kilometres.
The quality and accessibility of educational institutions have great implications for development. In most rural communities, educational facilities are often located at great distance from the communities. Thus, most children have to travel long distances to reach the nearest school. This contributes significantly to the low levels of enrolment recorded in most rural areas. Additionally, since most teachers are reluctant to live in relatively deprived areas of the region, most rural schools are also handicapped in terms of the quality of the education they provide.
The Free Compulsory Universal Basic Education programme (fCUBE) seeks to address four main constraints to the provision of good quality universal basic education in the country. The constraints are poor teaching and learning resulting in poor performance of children throughout the basic educational level, inadequate access to educational service, weak management capacity at all levels of education and unsatisfactory financing arrangements for the educational sector. The Ministry of Education’s accessibility policy goal is to provide one primary school facility within a travel distance not exceeding 3 kilometres and one JSS facility within a travel distance not exceeding 5 kilometres.
Post office facilities
Post office facilities are very few in the region, and are limited almost entirely to the district capitals. Less than one per cent (0.9%) of the 1,390 localities within the region have a post office within the locality. The district picture does not differ from the region as a whole. It varies from 0.3 per cent in Bolgatanga to 2.6 per cent in Builsa.
For about one in four localities within the region (25.6%) the nearest post office is less than ten kilometres away. About the same proportion of localities (25.1%) have the nearest post office being 30 kilometres or more away.
There are substantial variations in the proportional distributions of distance to nearest post office facility between the districts. For example in Bongo, 58.3 per cent of localities have the nearest facility less than 10 km away, compared to only 16.3 per cent in Bawku East. Since post office facilities are almost entirely available only in the district capital, the variations between districts in distance to nearest facility are more a reflection of the district’s size and the number and spread of localities within the district than any real differential access. This is why for example in Bongo, the smallest district, no household is more than 20 kilometres from a facility, while for Builsa and Bawku East, the two largest districts in terms of area, 51.9 per cent (Bawku East) and 41.1 per cent (Builsa) of localities are over 20 kilometres away from a facility.
Telephone facilities
The picture with regard to telephone facilities is not any different from what pertains to post office facilities. This is because before the advent of commercial communication centres, post and telecommunication facilities were usually under one roof. Only 0.6 per cent of localities within the region have a telephone facility, varying from 0.3 per cent in Bolgatanga to 3.8 per cent in Bongo. This may even be a reflection of the definition of locality used in the census and/or proximity of a locality to the district capital. Bongo is a more compact district, in terms of land area, than Bolgatanga.
At the district level, the localities with telephone facilities within 10 kilometres range between 4.2 per cent in Builsa and 57 per cent in Bongo. Due to its smallness, no facility is more than 19 kilometres away in this district. In Bawku West, 81.6 per cent of localities are 25 kilometres or more away, while in Builsa, the proportion is 68.9 percent. The lowest (27.3%) is in Kassena-Nankana.
The region as a whole is poorly served with telephone facilities. For over 80 per cent of households in the districts, the nearest telephone facility is five kilometres or more away. The situation has improved slightly with the introduction of commercial communication centres, pay phone booths, and mobile phone services. These facilities are however limited in coverage. They are available only in the Bolgatanga, Navrongo and Bawku townships. Bolgatanga, at present, has 90 Ghana Telecom pay phone booths and 179 privately owned commercial communications centres. Navrongo has 35 pay phone booths and 45 communication centres and Bawku has 44 pay phone booths and 65 communication centres. Mobile telephone services are available in only a limited number of localities, with “Spacefon” and Ghana Telecom’s “One Touch” systems operating from Bawku, Bolgatanga and Navrongo. Mobitel (Millicom) currently has no service in the region, but expects to operate from Bawku from early 2004.
Health facilities
There are two basic health care systems in the country and in the region. These are the orthodox Western type (allopathic) and the traditional (mainly herbal) systems. The orthodox system is grouped into four categories in relation to ownership. These are Government, NGOs, particularly religious organizations, large industrial establishments and private individuals.
The traditional medical system can be grouped into four main types of specialities. These are, traditional birth attendants (TBAs), who play the role of midwives, especially in the rural areas, faith healers, who operate from religious movements and derive their healing powers through faith in a Divine Being, fetish priests, including indigenous priests and priestesses of shrines, ritual and cult leaders, and herbalists. In some cases a blend of spiritual and herbal healing is employed. The majority of Ghanaians regard the traditional and modern medical systems as complementary and patronize both of them. Information collected on health facilities was only on the physical availability, distance to the nearest facility and personnel in the facility such as doctors, nurses and traditional healers.
The 2000 Annual Report of Regional Health Administration gives the regional and district distribution of hospitals, clinics and health centres. These consist of 37 (55.2%) government owned, 24 (35.8%) mission institutions and 6 (9%) private facilities. The hospitals in the region are sited in the five district capitals. The Bongo-Soe Health Centre is being upgraded into a district hospital. In Builsa 2 of the 8 clinics/health centres belong to religious organisations and the rest are government-owned. Government owns 7 of the 8 clinics in Kassena-Nankana while in Bongo 1 of the 6 clinics is a mission health centre. The district has no hospital, but the clinic is soon to be upgraded into a district hospital.
In Bolgatanga, there are 8 government, 3 religious organisation and 3 private clinics while 4 of the 10 clinics in Bawku West are government-owned and 3 are for religious organisations. Of the 14 clinics/health centres in Bawku East, 4 are mission facilities while the rest are government-owned.
Distances from locality to nearest facilities
The Ministry of Health’s accessibility standard is to provide 1 health facility within a distance not exceeding 8 kilometres from a locality. The distance to the nearest hospital for all localities. The data show that 47.1 per cent of the localities in the region are within 15 kilometres of a hospital, but only 0.6 per cent of these have the facility within the locality. Bongo has the highest proportion (84.9%) of localities located within 15 kilometres of a hospital while Bawku East has the least (33.9%). Nearly a third (29.7%) of localities are 25 kilometres or more from a hospital. This varies from 1.3 per cent in Bongo to 43.6 per cent in Bawku East.
The short distances of localities in Bongo to health facilities may create the impression that there is a widespread distribution of health facilities. The reality though is that the district is the smallest in area, such that even though the district has only a clinic with one doctor, the distances from this one facility are relatively short.
Four in five (80.3%) communities in the region have access to a clinic or maternity home within 15 kilometres of the locality, with Bongo having the highest of 98.7 per cent and Bawku East the lowest (70.7%). It is worth noting though that only 4.5 per cent have the facility in the locality itself. This proportion varies from 3.3 per cent in Bawku East to 10.1 per cent in Bongo. About one tenth (11.6%) of localities in Bawku East are 25 kilometres or more from the nearest clinic or maternity home. In all the other districts, the proportion of localities 25 kilometres or more from a clinic facility varies from 6.6 per cent in Bolgatanga to 11.6 per cent in Bawku East.
Taking into consideration the lack of adequate personnel manning all the health facilities, however, emergency cases may result in fatalities due to lack of prompt and adequate attention. People are likely then to seek assistance from the nearest facility including a traditional healer, or a licensed chemical seller, even if the particular emergency is outside the competence of that particular facility. They may only try to rush to a hospital or proper clinic when it is too late.
Medical personnel
Even though some of the clinics and hospitals are owned by non-governmental agencies, the doctors in the 5 hospitals are normally either fully employed by Government or are seconded to the hospitals by the Ministry of Health. Data from various sources of the Ministry of Health show that the human resource base of the orthodox health system is generally inadequate.
The data indicate that within the limited resources, Bolgatanga is the most endowed in terms of medical staff in 2000, having 41.7 per cent of doctors and 38.4 per cent of all medical staff, including 32.4 of nurses. Kassena-Nankana follows with 25.0 per cent of doctors, 19.1 per cent of nurses and 17.8 per cent of all medical staff. Bawku West is the least endowed, having only 3.7 per cent of all medical staff, followed by Bongo with 4.2 percent.
By 2003 Kassena-Nankana was the best-endowed district in terms of doctors, with16 (41.0%) of the 39 doctors in the region, while Bolgatanga had 12 or 30.8 per cent. The relatively large number of doctors in Kassena-Nankana may be due to increased recruitment into the Navrongo Medical Research Centre, where even though the doctors may be doing more research work and less direct patient consultation and treatment, they are known to undertake some clinical and surgical activities in the course of their research.
The population per doctor ratio for the region is 23,592, which is far higher than the national average of 1 doctor to 9,418 persons. At the district level, the ratio varies from a doctor to 9,343 people in Kassena-Nankana to 77,885 in Bongo. It is significant to note that all the doctors are located in the various district hospitals, and are therefore not immediately or readily available to most of the localities. The distance to the nearest doctor therefore depends on how far the patient is away from the health facility. That is why even though Bongo has only one doctor, the compactness of the district makes him available to most localities that are within 8 kilometres of the clinic.
Traditional health facilities
Every locality in the region reports the availability of a traditional health facility within the community. No one therefore has to travel outside the locality to obtain the services of a traditional medical practitioner (TMP). There are 1,147 people to one registered traditional healer, which is 20 per cent higher than the national average of one healer to 953 people.
Bawku West has the lowest ratio of one healer to 458 people, followed by Builsa with 513 people, about 80 times less than the population per orthodox doctor ratio in these districts. The highest ratio of 3,316 people to one registered traditional medical practitioner is in Bolgatanga. In the region as a whole, many people must be relying on traditional medical practitioners to meet a substantial portion of their primary health care needs.
Education facilities
The 1997 Core Welfare Indicators Questionnaire (CWIQ) survey reports that while primary and junior secondary school enrolment rates (in Upper East) are consistent with the national averages, accessibility remains a problem (Statistical Services, Accra Ghana, and February 2001).
Primary schools
The 2000 census data confirms that accessibility remains a problem. Taking the region as a whole, 47.1 per cent have a primary school in the locality. Although less than half of the localities in the region have a primary school within the locality, 32.4 per cent have a primary school within 1-3 kilometres. About four-fifths (79.5%) of localities in the region therefore have a primary school within 3 kilometres. Pupils of 20.5 per cent of localities, however, have to travel 5 kilometres or more to attend the nearest primary school. At the district level, Bongo has the highest proportion (63.3%) of communities with a primary school within the locality, while Bawku West has the lowest proportion (22.2%).
The proportion of localities with a primary school within 3 kilometres ranges from 74.2 per cent in Bolgatanga to 91.1 per cent in Bongo. The proportion is higher than the regional average (79.5%) in Builsa, Kassena-Nankana and Bongo.
In each district, pupils from some of the localities need to travel four kilometres or more to attend school. The proportion of these localities ranges from 8.9 per cent in Bongo to 25.8 per cent in Bolgatanga. Distance, thus, is likely to affect daily school attendance and eventually the dropout rate. Serious efforts must therefore be made by the district assemblies to bring primary education to the doorsteps of every pupil and thus enhance the full implementation of the fCUBE programme.
Junior secondary school
There are even fewer junior secondary schools (JSS) than primary schools in the region. Whereas 47.1 per cent of localities in the region have a primary school, only 21.4 per cent of localities have a JSS. There is no district in which the proportion of localities with a JSS is above thirty per cent. Kassena-Nankana has the highest proportion (29.6%) of localities with a JSS, followed by Bolgatanga (27%), while Bawku West (5.9%) has the least proportion of localities with a JSS.
The Ministry of Education’s policy is to site a JSS within a 5-kilometre radius. This means that the JSS facility is accessible to 78.2 per cent of localities in the region. For 21.8 per cent of localities in the region, students would have to travel 6 kilometres or more in order to attend the nearest JSS. The proportion of localities that has met the Ministry’s accessibility policy standard is greater than the regional average in four of the six districts. The proportion is highest in Bongo (89.8%) and lowest in Bawku West (66.7%).
The overall picture, however, is that there is the need to do to increase the number of JSS facilities in order to reduce travel distance to not more than five kilometres. Not only has the region not met fully the Ministry of Education’s policy standards on physical accessibility for primary and JSS facilities, statistics from the Ministry indicates that children in the region may not be adequately prepared for primary school since only 22.8 per cent of the teachers at the pre-school level are trained.
Teachers also have to handle large class sizes, especially at the primary school level. In the region as a whole, the pupil/teacher ratio at the primary school is 1:50.6. The highest ratio (1:70.7) is in Bongo and the lowest (1:43.4) is in Bawku East. The statistics also reveal that in each district, at the pre-school level, not more than 40 per cent of the teachers are trained. The proportion ranges from 17 per cent in Bongo to 38.5 per cent in Bawku East.
At the primary school level, however, the regional proportion of trained teachers increases considerably, ranging from 74 per cent in Bongo to 86.5 per cent in Bawku East. At the JSS level, the proportion of trained teachers is 80 percent, ranging from 71.7 per cent in Kassena- Nankana to 94.4 per cent in Bawku West.
Senior secondary school facilities
Senior secondary schools are even less available than junior secondary schools. In the region as a whole, there are 654 communities with a primary school in the locality compared with 297 communities with a JSS, less than half the number. The JSS/SSS ratio is even less than a tenth (297 communities with JSS compared with 27 communities with SSS).
In the region as a whole, only 1.9 per cent of localities have a senior secondary school within the community. The inadequate number of SSSs may hamper progression from JSS to SSS. Given the community secondary schools concept, there is much more to do in order to provide SSS facilities in the districts. Senior secondary schools however are usually boarding institutions and therefore the number and distances to nearest SSSs are not very critical for accessibility. In most cases, accessibility is determined more by competition as well as individual students and/or parental choice than by the proximity of the institutions.
At the district level, Builsa (3.7%) and Bongo (3.8%) have the highest proportion while Bawku East (1.2%) and Bawku West (1.3%) have the lowest proportion of localities with an SSS facility. Except Bawku East (26.5%) and Builsa (43.2%), the nearest SSS is within 10 kilometres for over 53 per cent of the localities in the districts.
SUMMARY OF FINDINGS, CONCLUSION AND POLICY
IMPLICATIONS
Summary of findings
The varied characteristics of the districts (demographic, social, economic, housing condition, availability and accessibility of selected basic community facilities) have policy implications for the districts. A brief summary of findings is presented before discussing possible interventions.
Demographic characteristics
The region’s population is not evenly distributed among the six districts. Three districts, Bolgatanga, Kassena-Nankana and Bawku East, contain 75.0 per cent of the region’s total population. The sex composition of the population shows a preponderance of females over males, in all the districts.
The age structure of the population in the districts is skewed towards the youth. The population below 15 years (0-14 years) varies from 40.5 per cent in the Kassena-Nankana, to 46.4 per cent in the Bawku West, District. The conventional dependent age groups (0-14 years and 65 years and older) range from 46.4 per cent in the Bolgatanga, to 53.6 per cent in the Bawku West, District.
Migration flow is very low. The proportion born in the locality of enumeration (i.e. nonmigrants) varies from 86.7 per cent in the Bolgatanga to 93.5 per cent in the Bawku West, District. The region is the least urbanized in the country, having only 15.7 per cent of the population living in urban centres; two districts, Builsa and Bongo, are entirely rural. All the measures of fertility examined indicate a high but declining fertility. Crude birth rates range from 22.5 live births per 1000 population in the Builsa to 46.6 births per 1000 in the Bongo, District. Total fertility rates range from 3.4 births per woman in the Builsa, to 7.5 births in the Bongo, District. The mean number of children ever had born to women, aged 40-49 years, ranges from 5.0 in the Bolgatanga, to 6.1 in the Bawku East, District.
The proportion of births in the last 12 months, by age of the mother, shows that the proportion at the beginning and at the tail ends of the childbearing ages are very close, indicating continuous child bearing by women in all the districts. About one in four of the births (22.8%) occurs to mothers aged 15-24 years compared to 17.1 per cent to mothers aged 40-49 years. There is evidence of high child loss in the districts. The survival rate of the children ever born varies from 70.0 per cent in the Bongo, to 80.8 per cent in the Bawku East, District.
Social characteristics
Household sizes are generally large in each of the districts. The proportion of households with six persons or more varies from 36.9 per cent in the Builsa, to 68.2 per cent in the Bawku East, District. The head of household is usually a male. The proportion of female95 headed households ranges from 11.3 per cent in the Bawku East, to 35.7 per cent in the Bongo, District.
The composition of households shows that the proportion of heads of households varies from 11.4 per cent in the Bawku East, to 19.2 per cent in the Builsa, and that of spouses of heads of households, ranges from 8.9 per cent in the Bongo, to 13.3 per cent in the Bawku East, District. The proportion of own children, of the head, varies from 33.5 per cent in the Bongo, to 44.5 per cent in the Bawku West, District. The proportion that is grandchildren and other relatives varies from 17.6 per cent in the Builsa, to 31.7 per cent in the Bongo, District. The fact that grandchildren and other relatives constitute 22.7 per cent of household members supports the view that the traditional extended family household composition has not changed much.
The traditional practice of early and almost universal marriage is reflected in the fact that the proportion of the total population, aged 15 years or older, who have never married varies from 18.5 per cent in the Bawku West, to 28.1 per cent in the Bolgatanga, District. Among the females, the proportion varies from 11.0 per cent in the Bawku West, to 21.0 per cent in the Bolgatanga, District.
Adherence to Traditional religion is predominant in the region. Almost one half (46.4%) of the population are Traditionalists, followed by Christians (28.3%) and Moslems (22.6%). Catholics constitute the majority (57.7%) of the Christian population, followed by the Charismatic/Pentecostals (21.7%). There has been an improvement in school attendance in the region. In 1984, 82.3 per cent of the population, aged six years or older, had never attended school. The proportion dropped to 69.4 per cent in 2000. In spite of this improvement in the educational sector, a substantial proportion of the population, in each district, has never attended school. The proportion of the population aged six years or older, who have never attended school varies from 61.2 per cent in Bolgatanga, to 77.8 per cent in the Bawku East, District.
The highest educational level completed, by 74.5 per cent of those who have ever attended school, is the primary and middle/JSS. This proportion varies from 72.2 per cent in Bolgatanga, to 81.1 per cent in the Bawku West, District. At every level of educational attainment, there is a higher proportion of males than females. Much of the female-male differentials in educational attainment, however, is at the middle/JSS or higher levels. In the Builsa District, for example, the overall difference in educational attainment is 8.4 per cent in favour of males. The male-female differential in educational attainment, which is negligible at the lower levels, increasingly widens at each successive level of educational attainment.
Only 23.5 per cent of the region’s population, 15 years and older are literate. Literacy in English only, or English and a Ghanaian language, varies from 12.2 per cent in the Bawku West, to 27.7 per cent in the Bolgatanga, District. Literacy in a Ghanaian language, 8.3 per cent for the region, is even lower than literacy in English only (14.4%). The proportion literate in a Ghanaian language varies from 3.5 per cent in the Bawku West, to 11.9 per cent in the Kassena-Nankana, District.
Economic characteristics
The three major occupations in the districts are Agriculture and related workers, Sales workers, and Production and Transport Equipment workers. Together, the three account for between 88.3 per cent and 96.0 per cent of the working population in the districts. Administrative and Managerial capacity is extremely limited in the districts, accounting for not more than 0.2 per cent in any district.
The three major industrial activities are Agriculture, including Hunting and Forestry, Wholesale and Retail trade, and Manufacturing. Agriculture is the number one industry with proportions ranging from 51.6 per cent in the Bolgatanga, to 85.3 per cent in the Bawku West, District.
In all districts, at least two out of every three of the economically active population are selfemployed without employees. The private sector provides employment for almost all the working population, with the proportion varying from 92.2 per cent in the Bolgatanga, to 97.2 per cent in the Bawku West. The private informal sector accounts for not less than 69.0 per cent in each district. There are slightly more females, than males, in the private sector. The formal sector (public or private) is a source of employment for only a small fraction of the work force in each district. Within this small numbers, there are twice as many males as females, in each district.
Housing condition and community facilities
Rooms in compound houses are the predominant type of dwelling units in all the districts. A high proportion of the households in each district, ranging from 81.6 per cent in the Bolgatanga, to 93.4 per cent in the Bawku West, District, live in dwellings owned by a relative. The quality of dwellings in the region and access to amenities are low. For example, mud/mud bricks account for over 80.0 per cent of wall materials in all districts. Additionally, thatch from grass, wood or mud/mud bricks account for over 75.0 per cent of material for roof in every district.
Only 12.4 per cent of households in the region have electricity. The kerosene lamp is the main source of lighting for at least three out of every four households. The proportion using the kerosene lamp varies from 78.1 per cent in the Bolgatanga, to 92.7 per cent in the Builsa, District. In the region, 50.0 per cent of households have access to potable water. About 14.0 per cent use pipe-borne water or a tanker service and 36.6 per cent use water from boreholes. About one in three households use well water for drinking and 15.2 per cent depend on natural water sources such as the spring, river, stream or rainwater.
Firewood, millet and guinea corn stock and charcoal are the three main sources of fuel for cooking in the districts. The use of firewood and charcoal has resulted in an increasing depletion of the vegetation cover in the region, with the associated negative impact on rainfall and farming. There are more rooms available to each household in the region than in the country as a whole. For the country, 61.8 per cent of households occupy only one or two rooms compared to 24.4 per cent of households in the region. There are also more households occupying seven or more rooms in the region (21.0%) than in the country as a whole (8.6%). The proportion of households occupying one or two rooms in the region varies from 9.3 per cent of households in the Bawku East, to 37.4 per cent in the Kassena-Nankana, District.
The number of sleeping rooms is generally lower than the total number of rooms occupied by households. About 39.0 per cent of households have only one or two sleeping rooms, with a variation from 19.1 per cent in the Bawku East, to 53.1 per cent in the Kassena-Nankana, District. The Bawku East District has the largest proportion of households with seven or more sleeping rooms (23.8%). Almost all households in the region (97.5%) have some cooking space within the premises of the housing unit, and 82.8 per cent use a space provided for bathing within the house. The situation with toilet facilities is different. Access to toilet facilities is significantly below the national average. Whereas in the country as a whole, only 20.2 per cent have access to no facility, in each district of the region, at least three out of every four households have no toilet facility (use bush, farm, etc).
The methods of waste disposal (both solid and liquid waste) are also not environmentally sound. In all the districts, almost all households dispose of their liquid waste on the street/outside gutter or in the compound of the house. About one in two households dump their solid waste “elsewhere”. Public dumpsites are not common as a method for waste disposal. The use of such dumpsites varies from about 3.0 per cent in the Bawku West, to about 20.0 per cent in the Builsa, District. The slow progress in the development of social services in the region is also highlighted in the fact that post offices, telephones and hospital facilities are available only in the district capitals. Less than one in eight localities has a clinic/maternity home. Whereas every community has a traditional healing facility, only about 28.0 per cent of the localities in the region have access to a hospital within the community or satisfy the Ministry of Health’s accessibility standard of a health facility within eight kilometres. About 67.0 per cent of localities have a clinic/maternity home within the same distance.
Educational facilities are also not adequate. Less than half (47.1%) of localities have a primary school within the community and an additional 32.4 per cent can access a primary school within the stipulated Ministry of Education’s standard of not more than three kilometre-radius. Whereas almost one in every two localities in the region has a primary school, only one in every five has a JSS. About 78.0 per cent of localities in the region, however, have met the Ministry’s accessibility standard of a JSS within five kilometre radius. Senior secondary schools are the least available, in terms of numbers. Since senior secondary schools are usually boarding institutions, however, the number of and distances to the nearest SSS institutions are not very critical for accessibility. In most cases, accessibility is determined more by the individual student’s and/or parental preferences and/or affordability, than by the proximity of the institution.
Conclusion
Comparison of demographic indicators at the national and regional levels
The indicators show that, for most of the demographic characteristics, the values for the region are not close to those of the country. The population density of the region is higher than the national average. The national inter-censal growth rate is far higher than that of the region. This is also reflected in a national inter-censal increase which is 2.5 times that of the region.
The age structure of the region differs slightly from the national picture in terms of the broad age groups 0-14 years, 15-64 years, and 65 years and older. The sex ratio is also not much at variance with the national and regional figures. The proportion urban in the country (43.8%) is almost three times as large as that of the region (15.7%).
The low level of population movement into the region is reflected in the fact that the proportion born outside the locality of enumeration is 10.0 per cent compared with the national average of 31.0 percent. The area of origin, however, does not differ much. The proportions born in another locality in the region, in another region, and outside Ghana, are not much different for the national and regional averages.
The fertility indicators (CBR, TFR and MCEB) for the region compare favourably with the national average. The proportion of children surviving, however, is about 10.0 percentage points lower for the region.
Comparison of socio-economic indicators at the national and regional levels
The region falls low in most of the indicators that measure socio-economic development, such as level of education, literacy and accessibility to social services. Illiteracy is very much higher in the region than for the country as a whole. Literacy in English only or in both English and Ghanaian language, which is effectively the functional ones vis-à-vis much of published materials, is only about 20.0 per cent for the region compared to about 47.0 per cent for the country. Educational attainment is consistently lower in the region, at every level, compared to the national pattern.
Professional/Technical, Administrative, Managerial as well as Clerical occupations are all twice as high in the country as in the region. Agriculture, on the other hand, is the occupation of about two in three for the region, compared with one in two for the country. The proportion of employees for the region is a third that of the country. The private informal sector predominates both the national and regional economy. The proportion of the private formal sector in the region, however, is only one half of the national.
Housing quality is far poorer in the region than for the country. Electricity is available to only one in eight households in the region while it is about two in five households nationwide. Toilet facilities show the greatest discrepancy. Whereas only one in five households, nationally, have no toilet facility, about three in four households in the region have no toilet facility.
Comparison of indicators at the regional and districts levels
The values of the indicators show that most of the demographic characteristics of the districts are very similar to the regional pattern. The age structure of the region is reflected in the age structure of each district. Similarly, sex ratios (males per 100 females) are only slightly above the regional value of 92.6 in the Builsa and Bolgatanga, Districts.
All the fertility indicators observed for the region differ only slightly for each district except Bongo, where all the indicators are about twice that of the regional. Population sizes and densities are however not uniform in the districts. Three districts (Bawku East, Bolgatanga and Kassena-Nankana together) contain about 75 per cent of the region’s population. These three have densities higher than the regional figure of 104 people per sq km. The proportion of the urban population in the Bolgatanga District is twice the regional average while that in the Bawku East District is almost three times higher. The low level of population movement in the region is reflected in the fact that the proportion of the population born outside the locality of enumeration is not significantly different in the districts.
Some significant differentials between districts are observed for educational attainment and literacy. For example, literacy in English only is about 30.0 per cent higher in the region than in Builsa and about 56.0 per cent higher than in the Bawku West, District. The proportion that have ever attended school is higher in three districts (Bolgatanga, Kassena-Nankana and Bongo), than the regional average, and substantially lower in the Bawku East and the Bawku West Districts. There is evidence of over concentration of “essential services” in Bolgatanga, Navrongo and Bawku, which are all district capitals. The proportion of households using electricity as the main source of lighting is about one-half the regional average in three districts, Builsa, Bongo and Bawku West and above the regional average in the Bolgatanga, and Bawku East, Districts.
Whereas 61.1 per cent of households in the Bolgatanga and 58.7 per cent in the Kassena- Nankana Districts have access to potable water, the proportion is far below the regional average (50.3%) in the Builsa (36.2 %), Bawku West (36.8 %) and Bawku East (42.0%), Districts. Bolgatanga has 41.7 per cent of the region’s doctors, 32.4 per cent of the nurses and 36.3 per cent of the para-medical staff. The Bawku East District has 12.5 per cent of the doctors, 32.2 per cent of the nurses and 26.0 per cent of the para-medical staff. The Kassena-Nankana District has 25.0 per cent of the doctors, 19.1 per cent of the nurses and 17.6 per cent of the para-medical staff. The three districts together have 85.6 per cent of all the available medical staff.
Policy implications
The overall level of development and demographic structure in the country conceals very marked differences between and within regions, districts, rural and urban areas. It was to effectively address the imbalance in development that the decentralization programme was initiated in 1984 with the District Assemblies established to “initiate and coordinate the processes of planning, programming, budgeting and implementation of district plans, programmes and projects” relevant to the needs of particular districts and communities.
All poverty indications show that northern Ghana (Upper East, Upper West and Northern) continues to be the poorest area in the country (Ghana Statistical Service, 2000). The characteristics of the districts (demographic, social, economic, housing conditions and community facilities) in these three northern regions therefore need to be taken into account in deciding on the broad areas for policy strategies and interventions.
All the measures of fertility indicate continuous child bearing throughout the reproductive ages. The region’s child survival rate of 78.6 per cent is 10.3 per cent lower than the national average of 86.7 percent. Even though the region’s population growth rate of 1.1 per cent is much lower than the national rate of 2.7 percent, it should nevertheless be of much concern because of the low level of employment and low level of exploitation of available resources within the region to sustain the population. This situation is reinforced by the fact that the population is relatively young, with 41.4 per cent below 15 years; this requires substantial expansion in the local economy to provide employment opportunities, as well as educational and health facilities.
The regional total fertility rate (TFR) of 4.0 and the mean age of child bearing (33 years) implies a continuous child bearing throughout the reproductive periods. This situation should prompt the Regional Population Council and the District Population Advisory Committees to put in place population management policies aimed at educating the population, through advocacy programmes, on the need of a smaller family size, on a sustainable basis. The analysis shows that 77.8 per cent of households in the region are headed by males. In an environment (northern Ghana) where males are mostly recognised by the household members as being responsible for their upkeep and maintenance, even if in reality a female is maintaining the household, the proportion of female-headed households is a welcome positive development that should be encouraged.
The fact that females are increasingly assuming roles as heads of households does not mean that their role in decision making may also have increased, because the patriarchal system still marginalizes females in diverse ways. This may tend to exclude females from the decision-making process when it comes to the development of their communities. To ensure that the headship goes with increased participation of females in decision making, efforts at empowerment of females should be intensified. Such efforts should include sensitizing the male population to perceive females as partners in decision-making processes in their respective communities.
The region has more females than males. One should, therefore expect more girls than boys in schools. Generally, in primary schools, there are as many girls as boys, a situation which often changes at the JSS level and beyond when the female dropout rate becomes high. From the JSS level, many girls, in their puberty age, are given out in marriage, and some migrate to the south, as house helps or “Kayayee”, to earn a living. The main cause of the low girl-child education, especially after the primary school level, is not merely poverty but the extreme poverty of parents (Regional Planning Coordinating Unit, 2003). It may also be due to the fact that not much education has been given to change the age-old perception that the girlchild’s education is a waste of parental resources and will only benefit the man she marries in the future. The girl-child education can only be improved, at the JSS level and beyond, when the local economy is improved. Several policy issues are involved.
First, the people should be educated on the need to send the girl-child to school and have her retained for a better future for the girl, the parents and the entire society. Secondly, existing cultural practices, in relation to the position of women and girls in society, should be critically examined and modified or scrapped. There should be intensified education on the benefits of schooling to help stem girl-child dropout from schools, to provide incentives and attractive conditions to help retain girls in school.
The most pressing population and development problems requiring policy formulation and interventions are human reproduction/natural increase issues, young age structure and high dependency burden, high level of illiteracy, especially among the adult population, nonavailability and/or poor access to social infrastructural facilities and services, including electricity and health services, uneven distribution and poor quality educational infrastructure. The region suffers from low levels of formal sector or non-farm employment, high levels of unemployment and high levels of self-employment (over 75.0% of all employment). The region’s forest reserves are threatened with destruction through the use of wood for building and cooking fuel (fire wood and charcoal). All the above emphasise the importance of intensifying the process of extension of social infrastructural facilities within the region instead of the current over concentration of services in only a few district capitals.
Interventions
Various programmes, projects and activities have been suggested over the years to address the population and development problems of the country, but problems of implementation have made it difficult to make progress. The already documented policies, programmes, projects and activities are extensive and comprehensive enough to meet the needs and priorities of individual districts, sub-districts and communities. Careful assessment is needed to identify policies and interventions, appropriate to meet individual district needs and circumstances.
The planning, execution and monitoring of various interventions should adopt the district/community “ownership” strategies. Interventions should also be in phases or stages. Mass education programmes should be embarked upon and pursued with all seriousness before introducing interventions to educate people on the benefits of each intervention, to the individual and to the community, as well as on the consequences of not implementing the interventions on a sustainable basis.
Programmes, projects and activities that are either “population influencing or population responsive” include improving and expanding the health of mothers and children (programmes on breast-feeding, ante-natal care, post-natal care, growth monitoring, child survival, safe motherhood), reduction in the incidence of teenage pregnancy and reduction in incidence of child bearing among women older than 35 years. The health and reproductive health specific programmes include the Expanded Programme of Immunization (EPI) and family planning services delivery programmes (importation of contraceptives, distribution of contraceptives), sale of contraceptives, training of communitybased distributors, training of traditional birth attendants (TBAs). Family planning IEC programmes to encourage and maintain the involvement of males in family planning, control of sexually transmitted diseases, including HIV/AIDS (training of health workers, IEC on STDs) to provide training and understanding on how population and development are related (training programmes, workshops for district level policy makers and implementers, heads of Government departments, traditional leaders).
There are other health improvement programmes for the physically challenged and other vulnerable groups. These are the improvement of health and welfare services for people with physical disabilities (rehabilitation, counselling), improved health and welfare of the aged (housing for old people, medical needs, and recreational programmes). Females constitute another group of the population that appears to be excluded and needs to be integrated into the development process. The full participation of women is not only necessary as a social right, but is also essential for increased productivity. Programmes on the empowerment of women to improve upon the role and status of women, through adult literacy programmes, girl-child education and income generating activities for women, should be promoted to enable females to participate fully in the development process.
Agricultural improvement and food security issues have also been addressed. There are programmes to improve agriculture and food production (extension services, introduction of new varieties of crops). Also included in this category of interventions are agricultural reform or transformation (research into land tenure systems, land use planning, appropriate technology) and food security issues (production, storage, distribution of food). Poverty alleviation programmes and broad public health and income generation programmes and the provision of basic community services need to be implemented to the benefit of the disadvantaged in society, particularly the vulnerable and excluded groups. The Public health care programmes include the expansion and improvement of health, water and sanitation, surveillance, prevention and control of malaria, yaws, oncho, guinea worm, diarrhoea diseases, acute respiratory infections, and mental health.
Enhancing rural and urban development through farm settlement schemes and the establishment of small-scale industries, using appropriate technology, is also recommended as an effective programme. In order to effectively protect the environment and fight desertification, tree planting programmes should be intensified. In this respect, particular attention should be given to the planting of such drought resistant trees as the cashew, neem, baobab, dawadawa and shea. The practice of preserving groves as forest cover, should be demystified and revived. Other programmes such as educational programmes (provision of schools, teachers bungalows), functional literacy programmes and migration and spatial distribution programmes (creation of growth centres to encourage or discourage people moving to specific towns or villages within the districts) need to be assessed to identify areas of resource constraints and difficulties to full implementation.
Project performance is an essential component of monitoring and evaluation of projects (programmes that specifically address issues of quality of project inputs and outputs, the effectiveness and efficiency of project implementation agencies, cost-benefit studies) should be intensified to assess the effectiveness of programme. This should involve the collection, analysis and dissemination of population data (baseline demographic surveys, registration of births and deaths), and population information dissemination programmes (awareness programmes on population problems, will encourage the use of population data). The training of staff to acquire the skills that encourage and improve routine data collection, analysis and dissemination of routine data on the activities and programmes of various government and non-governmental organizations, are necessary for addressing development problems.
District Assemblies in the region face problems in identifying, prioritizing and implementing policies and interventions specific to their districts and communities. The most important of these, which are of immediate concern are adequate supporting infrastructure, trained staff, and financial resources. These will enable them to prepare coherent district development plans and also take charge of initiating, implementing and monitoring integrated programmes, projects and activities.
